Fig. 3.
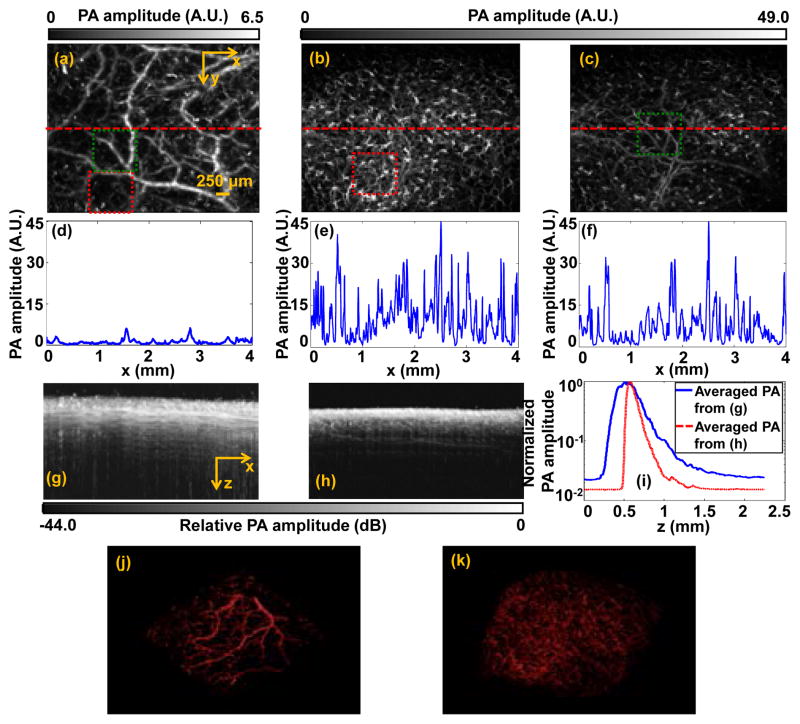
In vivo PAM of mouse scalp facilitated by optical clearing. (a) PAM image before optical clearing. (b) PAM image with capillaries after optical clearing. (c) PAM image with parts of capillary layer digitally removed after optical clearing. (d–f) PA amplitude along the red dashed line in (a–c). Maximum-amplitude-projection image along the y axis (g) before and (h) after optical clearing. (i) PA amplitude averaged along the x direction of (g) (blue line) and (h) (red dashed line). 3D PA image (j) (Media 1) before and (k) (Media 2) after optical clearing.

