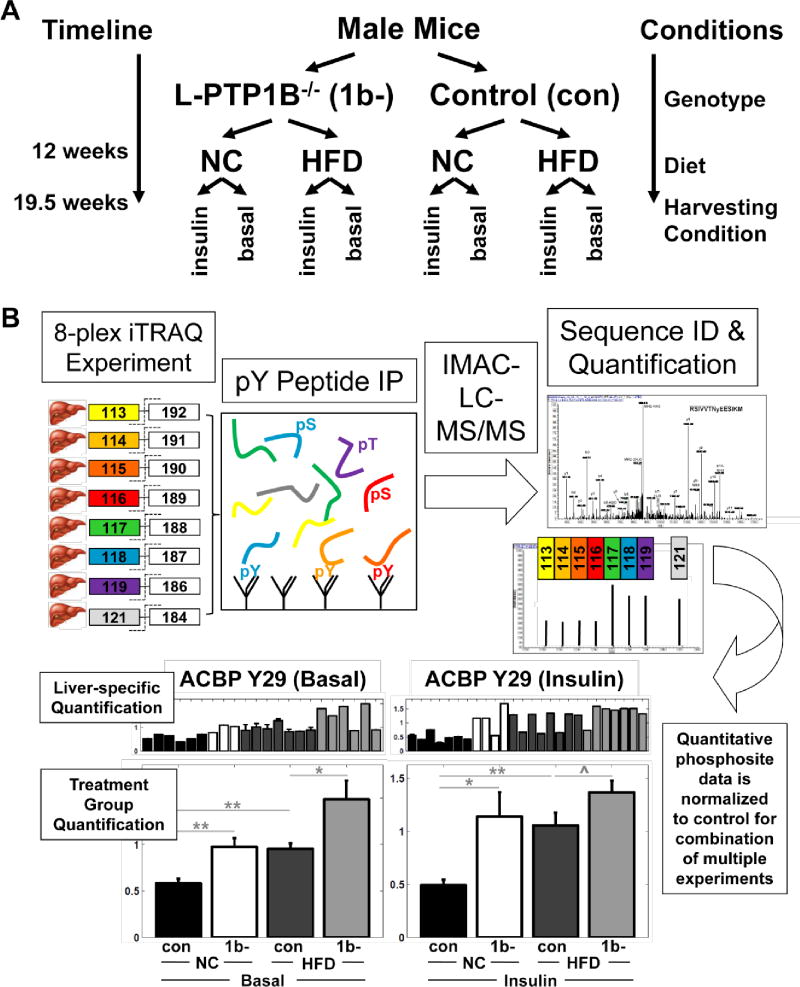
Figure 1. Study Design and Phosphotyrosine Analysis.
(A) Study design.
(B) Eight peptide samples, purified from individual livers, were chemically labeled individually with a unique 8-plex iTRAQ isobaric mass tag. Labeled peptide samples were combined and phosphotyrosine-containing peptides were enriched by phosphotyrosine peptide IP using pan-specific phosphotyrosine antibodies. Phosphorylated peptides were further enriched by IMAC prior to analysis by LC-MS/MS, resulting in hundreds of MS/MS phosphopeptide fragmentation spectra. Each MS/MS spectrum yields (1) sequence information and (2) iTRAQ reporter peaks whose intensities are proportional to the abundance of that particular phosphopeptide in the corresponding samples. To enable phosphopeptide quantification across multiple 8-plex MS experiments, each experiment was normalized to a control liver peptide sample, kept constant across experiments.

