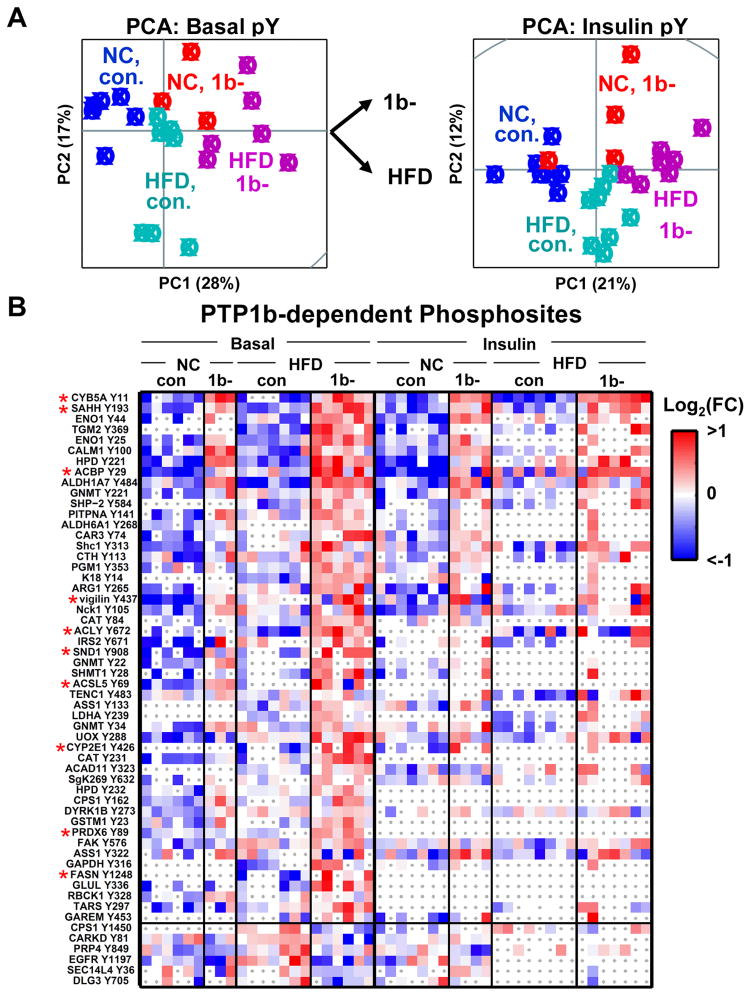
Figure 2. Diet and Genotype Dependencies in the Phosphotyrosine Network.
(A) Insulin-stimulated and basal liver samples are plotted in the principal component plane as a function of mean-normalized tyrosine phosphorylation profiles.
(B) Heatmaps of the phosphorylation sites most significantly correlated to genotype (raw, context-specific p-value < .025, see Methods). For basal or insulin datasets, the phosphorylation level of a phosphosite was normalized to the corresponding phosphosite mean (basal or insulin) and then log2-transformed. Missing data points are denoted by grey dots over white boxes. Red asterisks denote lipid metabolic enzymes. The phosphosites are separated into two clusters, depending on whether phosphorylation on those sites increases or decreases upon PTP1b deletion.

