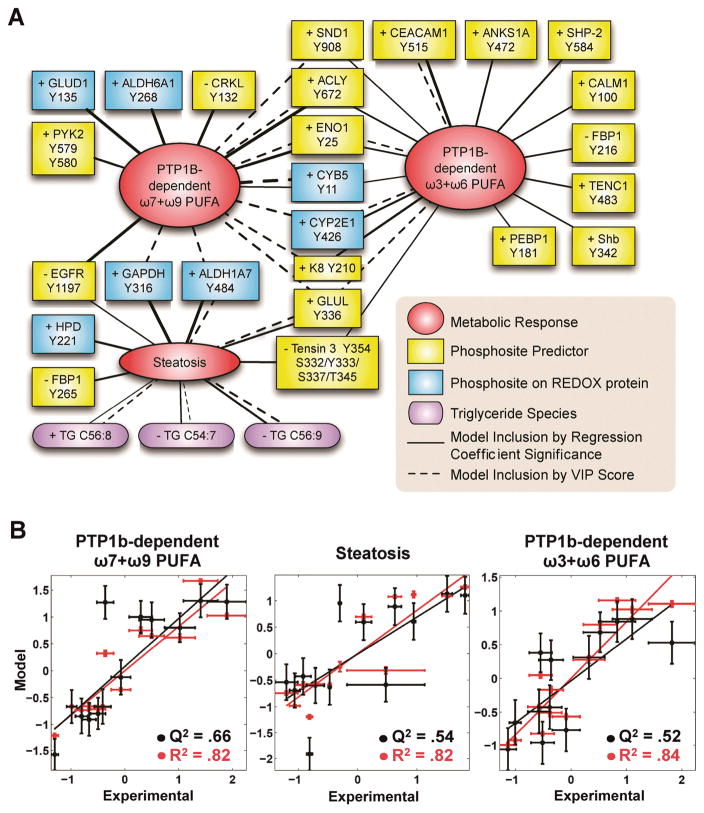
Figure 7. Multivariate Models of Lipidomics Phenotypes.
(A) The phosphosite and metabolite predictors that were included in final SMR models are connected to phenotype nodes by edges whose widths reflect the importance of the phosphosite or metabolite to the model. The (+) or (−) denotes the sign of predictors’ regression coefficient in the model. Final models were built using two model reduction techniques, as denoted in the legend and described in Methods.
(B) Quantitative prediction (black) and fit (red) for ω7+w9 PTP1b-dependent PUFA, steatosis and ω3+ω6 PTP1b-dependent PUFA models using model reduction by regression coefficient significance (see Methods). Error bars denote experimental and model SEM.

