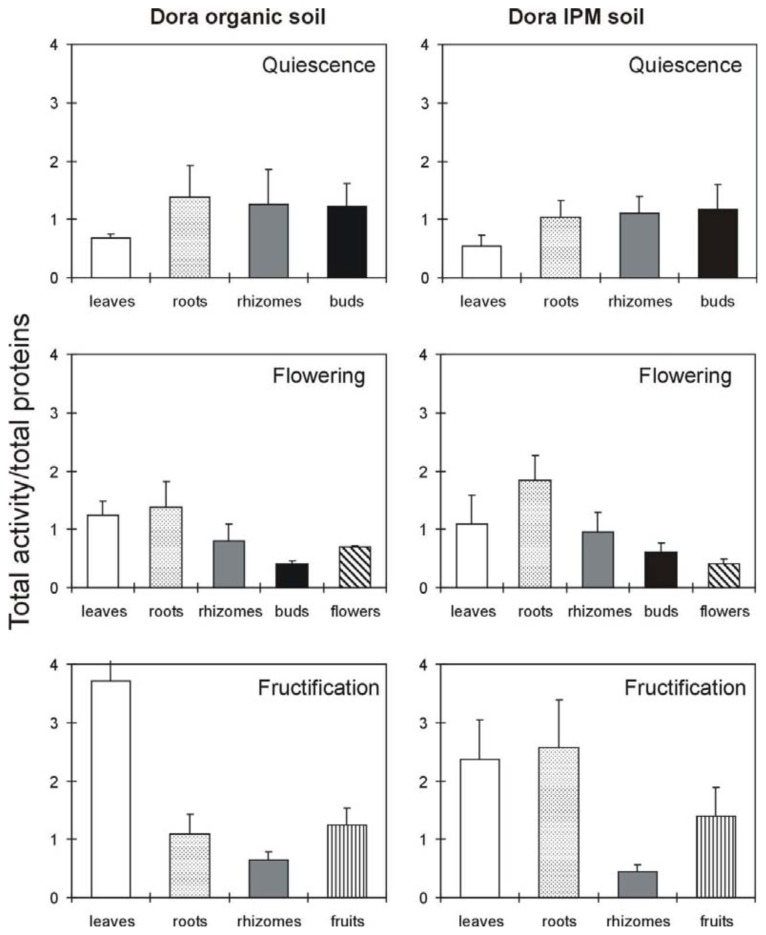
Figure 3.
Distribution of total activity in different Fragaria × ananassa (cultivar Dora) tissues during various phases of the life cycle. The total activity was normalized to the total proteins (mg) present in each tissue. The IC50 values ranged from 5 to 143 μg/mL (supplementary file, Table S1). The values reported in the graphs are the total activity ± standard deviation. The results are the means ± standard deviation of three experiments, each performed in duplicate. The statistical analysis was performed using Student’s t test (confidence range 95%).

