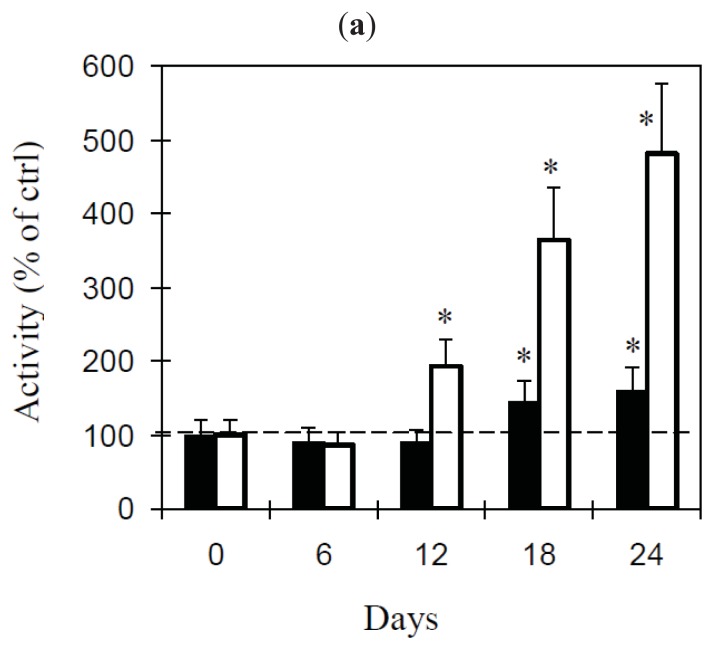
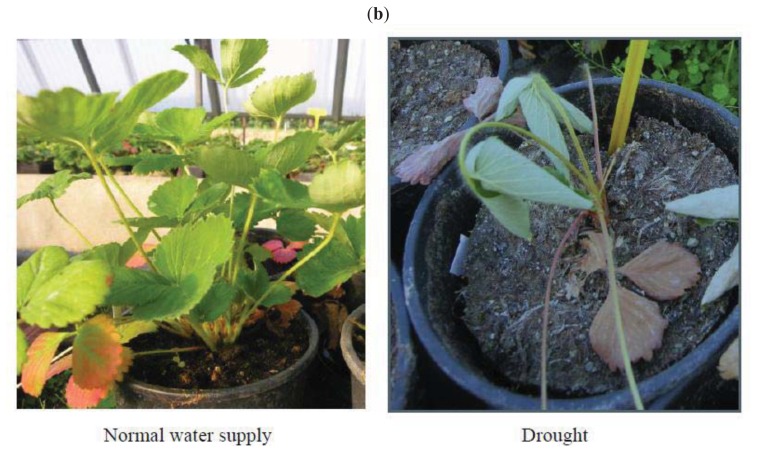
Figure 5.
Effect of drought on Dora and Record plants. (a) Activity in Dora (black columns) and Record (white columns) stressed leaves. The activity (total activity, calculated as the specific activity per whole basic-fraction proteins, normalized to the total proteins of the crude extract) in stressed leaves is expressed as a percentage of that in the leaves of control plants grown under the same conditions and with a normal water supply. The IC50 values ranged from 11 to 100 μg/mL (supplementary file, Table S2). The results are the means of four experiments performed in duplicate. Standard deviation never exceeded 15%. The statistical analysis was performed using Student’s t test (confidence range 95%). The asterisks indicate statistical significance for the stressed plants in comparison with the plants at the start of the experiment (p < 0.0001); (b) Normal and stressed leaves of Record plants at day 18.


