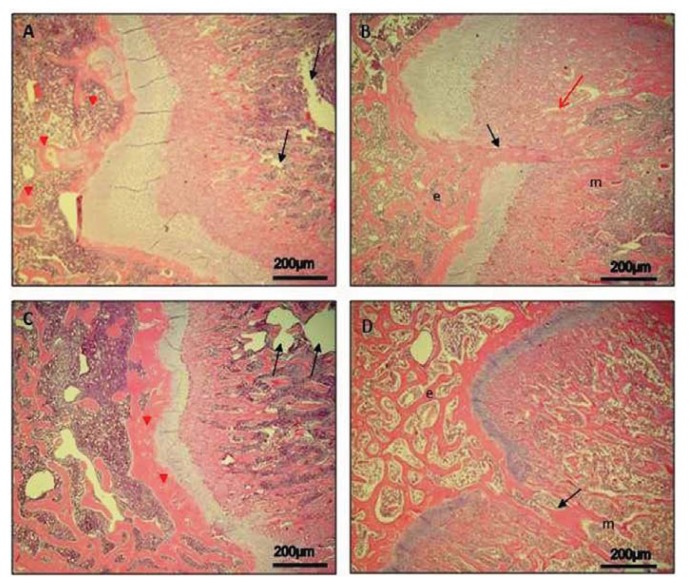
Figure 1.
Epiphyseal growth plate in both control and experimental rats and time-course progression of osteogenesis. H&E staining. (A) Day 14, control bone: reduced epiphyseal growth plate. Metaphyseal osteogenesis (black arrows). Epiphyseal osteogenesis (red arrowheads). Magnification 10×; Scale bars: 200 μm; (B) Day 14, experimental bone: the mesenchymal cells in the bridge replaced by neo-formed bone trabeculae (black arrow) as consequences of the intramembranous osteogenesis; epiphysis (e) and metaphysis (m). Magnification 10×; Scale bars: 200 μm; (C) Day 30, control bone: considerably reduced epiphyseal growth plate. Diaphyseal osteogenesis with extension of diaphyseal marrow cavity (black arrows). Epiphyseal osteogenesis with a thick layer of bone tissue (red arrowheads). Magnification 10×; Scale bars: 200 μm; (D) Day 30, experimental bone: invasion by bone formation (black arrow), epiphysis (e) and metaphysis (m). Magnification 10×; Scale bars: 200 μm.

