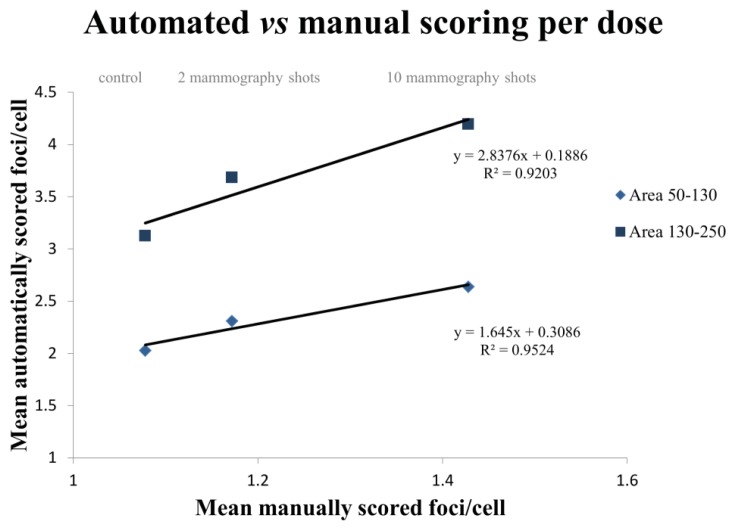
Figure 10.
Agreement between automatic and manual scoring. One thousand cells were scored both manually and automatically for each dose (control, two mammography shots and 10 mammography shots). The mean number of foci per cell obtained with the Spot-counting system was plotted versus the manual scoring. The lines represent the results obtained when sorting the cells by area: 50–130 area range (rhombs) and 130–250 (squares). The small area range gave a better fitted result.

