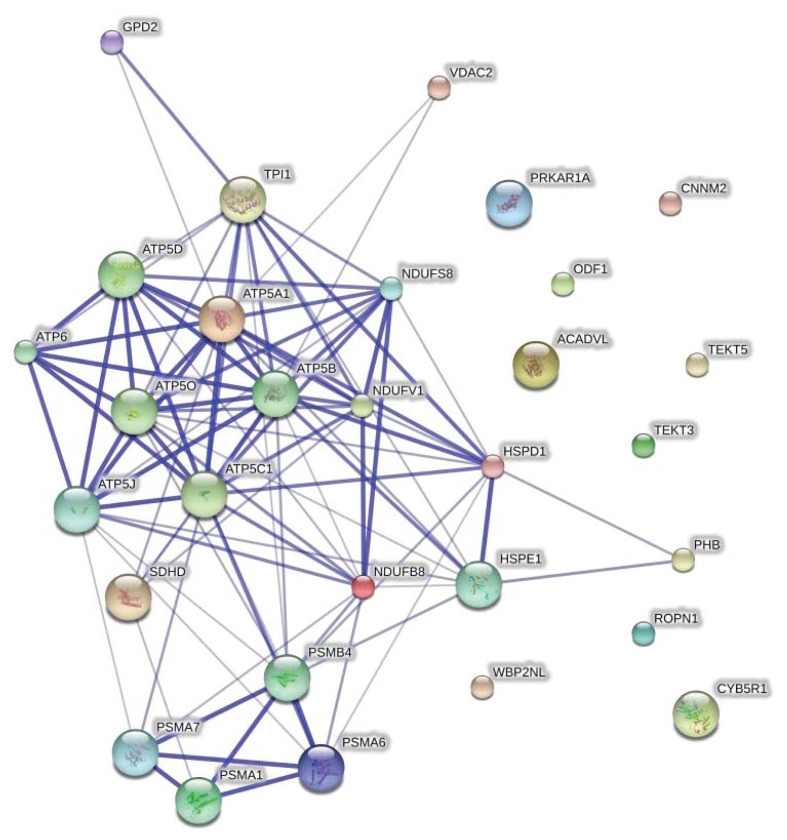
Figure 4.
STRING interaction network showing the association between differentially expressed proteins. The interaction map was generated using default settings (Medium confidence of 0.4 and 7 criteria for linkage: neighbourhood, gene fusion, co-occurrence, co-expression, experimental evidences, existing databases and text mining). Ten additional interplay proteins were also added to each network. The protein names and gene symbols used in this network are listed in Table 2.

