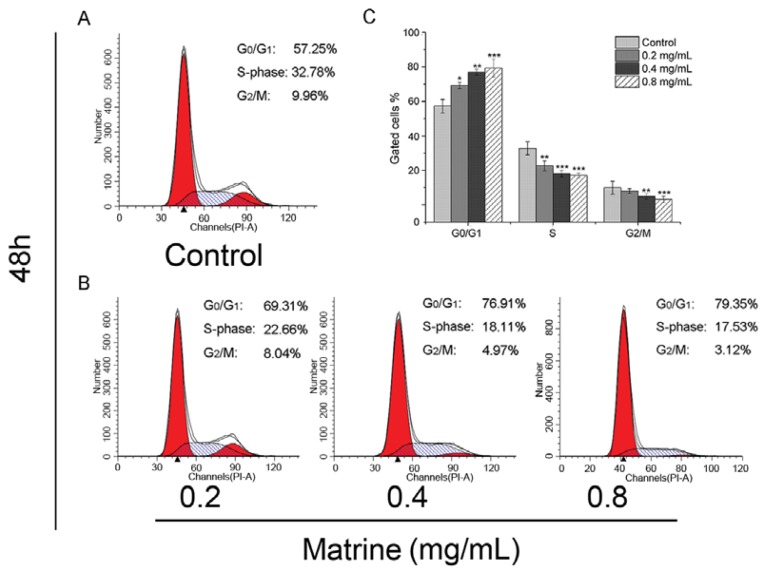
Figure 3.
(A) Cell cycle distributions in M21 cells as control; (B) Cell cycle distributions in M21 cells with Matrine in different concentrations as indicated. M21 cells were treated with Matrine for 48 h before PI staining; (C) The analysis of cell cycle distributions in M21 cells with Matrine. All data were expressed as means ± SD of three separate experiments. Significant differences from untreated control were indicated as *p < 0.05; **p < 0.01; ***p < 0.001.

