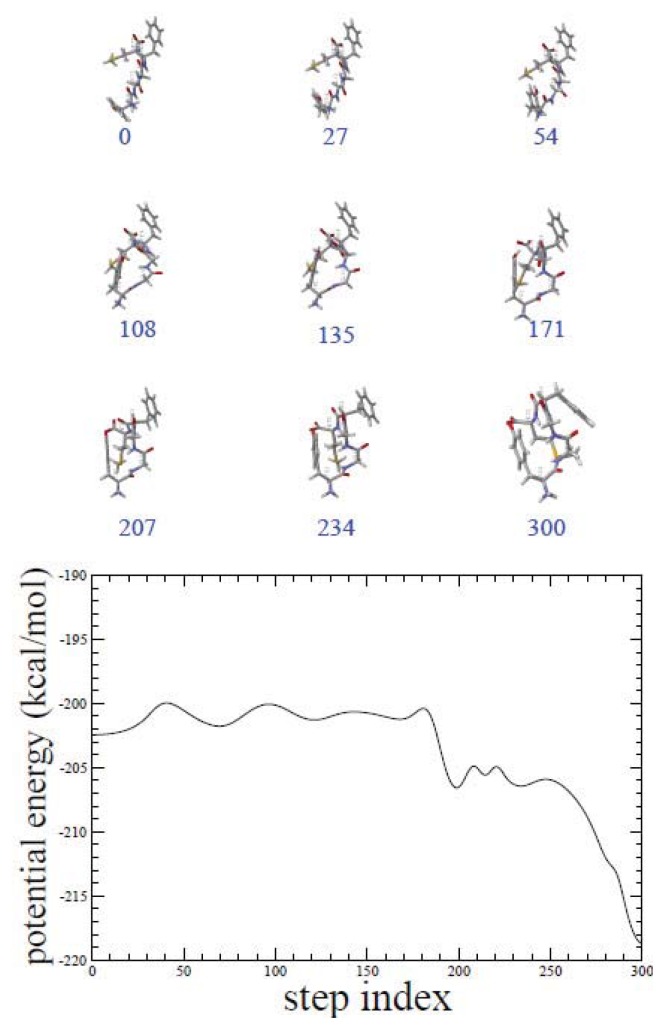
Figure 2.
Snapshots of the lowest potential-energy-barrier pathway for met-enkephalin are shown. Potential-energy fluctuation is shown along the ADMD step index. As the index increases, the potential-energies related to the pathway model undergo fluctuation. Potential-energy fluctuations associated with the most-fit (lowest potential-energy barrier profile) pathway from the simulations are shown.

