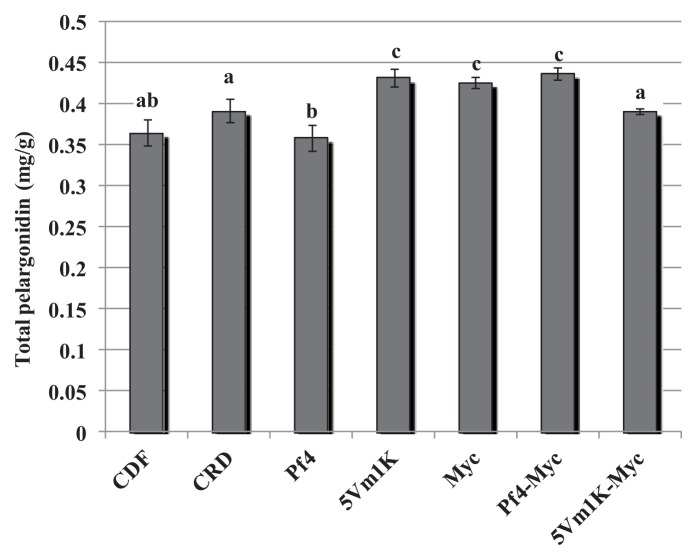
Figure 6.
Mean (±standard error) total pelargonidin concentration (mg/g) measured in strawberry fruits. Different letters indicate statistically significant differences between treatments. Plant treatments are identified as follows: CDF: Control 100, uninoculated plants with traditional fertilization; CRD: Control 70, uninoculated plants with 70% of the traditional fertilization; Pf4: plants inoculated with P. fluorescens Pf4 with 70% of the traditional fertilization; 5Vm1K: plants inoculated with Pseudomonas sp. 5Vm1K with 70% of the traditional fertilization; Myc: plants inoculated with AM fungi and with 70% of the traditional fertilization; Pf4-Myc: plants inoculated with AM fungi and with P. fluorescens Pf4 with 70% of the traditional fertilization; 5Vm1K-Myc: plants inoculated with AM fungi and with Pseudomonas sp. 5Vm1K with 70% of the traditional fertilization.

