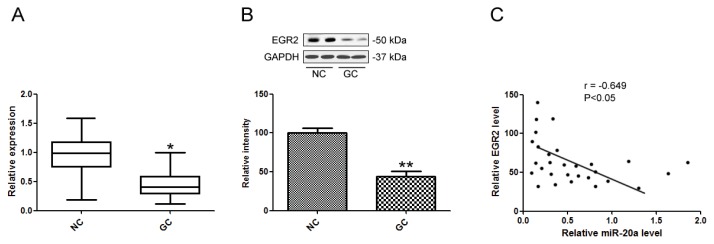
Figure 6.
miR-20a was inversely correlated with EGR2 expression. (A) EGR2 mRNA levels in GC tissues were analyzed by qPCR; (B) EGR2 protein levels in GC tissues were analyzed by Western blot; (C) Correlation of miR-20a expression and EGR2 mRNA level was analyzed. The data represented triplicate measurements. *p < 0.05, **p < 0.01 compared with control.

