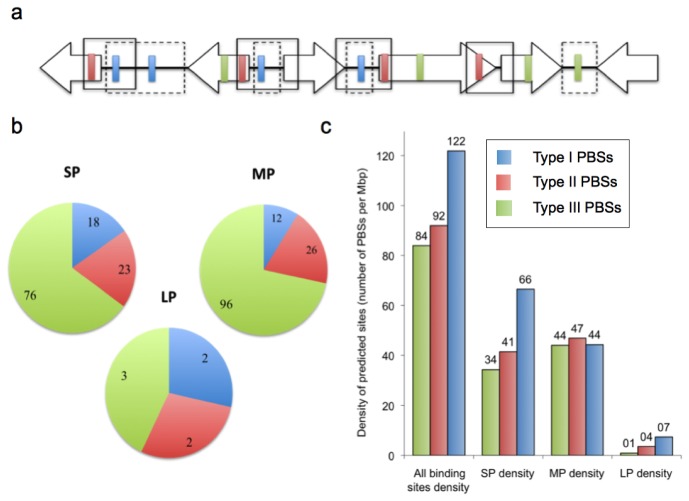
Figure 2.
Distribution of predicted binding sites in the At. ferrooxidans ATCC 23270 genome sequence. (a) Hypothetical gene organization in the At. ferrooxidans genome showing the classification of predicted binding sites (PBSs) in three sets according to their position relative to an open reading frame start. PBSs found in sense intergenic regions (Type I) (see text) are indicated with blue rectangular blocks. Type II and Type III PBS are denoted with red and green, respectively. Intergenic regions are indicated by dashed squares. The continuous line denotes the permitted “250 bp zone” (see text); (b) Relative abundance of Type I, II and III PBSs in the total set; (c) Compared abundance of the SP, MP and LP in the three PBS types according to a calculated “density” parameter. Densities were calculated dividing the number of PBSs in each subset by the number of total bases in the At. ferrooxidans genome available for each subset (total intergenic bp in the genome (tIG) for Type I; sum of total “250 bp zones” (t250Z) minus tIG bp in the genome for Type II; total bp minus the sum of t250Z in the genome for type III).

