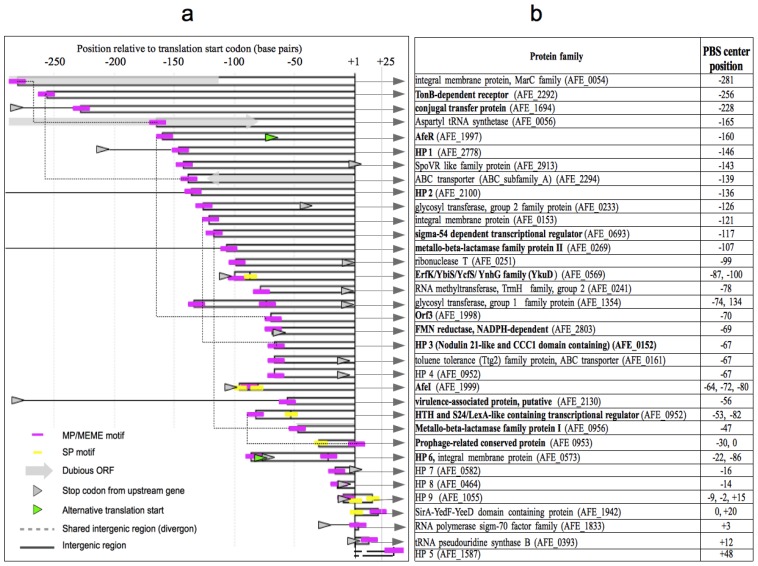
Figure 4.
Genomic organization of selected predicted binding sites (PBSs) in the context of their putative gene targets. (a) Position of PBSs respect to a predicted translation start nucleotide. “+1” represents the position of the adenine in the start codon. The bars represent the distance between the start codon and the center of a particular PBS. Magenta rectangles and yellow rectangles indicate MP/MEME-type and SP-type PBSs, respectively. When more than one PBS is present upstream of the same gene, the rectangle is fragmented at that particular position and the corresponding square is centered there. Shared PBSs from diverging genes are connected by a dotted line. Stop codons of ORFs located upstream of the gene is indicated by a grey arrowhead. Absence of an arrowhead means that there is no upstream gene in the shown intergenic region range. Alternative start codons are indicated by a green arrowhead; (b) Identified gene functions downstream of the PBS-containing regions shown in “a” and PBS centers positions are indicated. Genes which have a PBS located in an intergenic region with no overlapping coding sequence, and that resemble the position of the afe-box are shown in boldface. The “AFE” gene number is indicated. Hypothetical proteins (HP) were numbered arbitrarily. To gain extra insight into the gene functions, current annotations where revised. For this reason, a slightly different annotation compared to the available one at CMR may appear.

