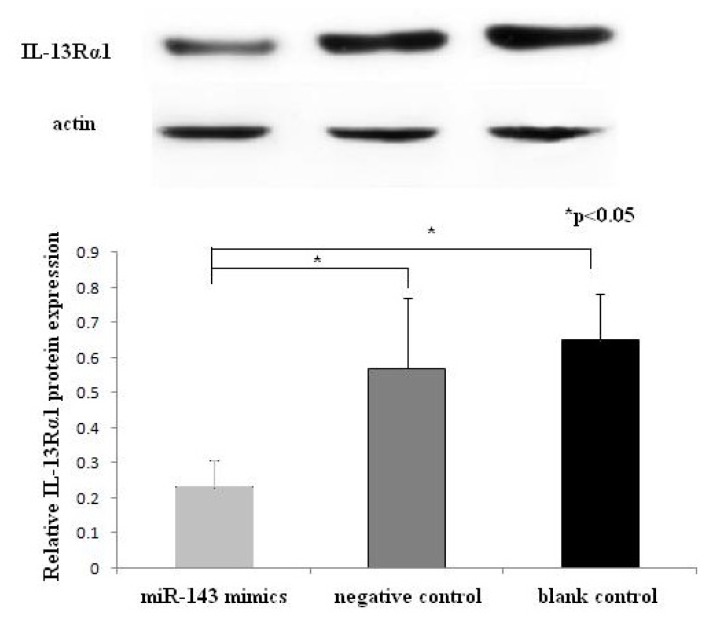
Figure 5.
Western blot analysis of IL-13Rα1 protein 48 h after transfection. For the three groups: miR-143 mimics, negative control group and blank control group. Experiments were done in duplicate. Western blot analysis showed that the relative expression of IL-13Rα1 protein in the miR-143 group was much lower than in negative and blank control groups (*p < 0.05 for each).

