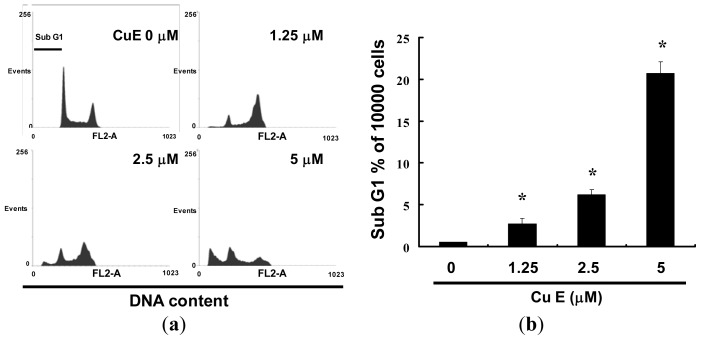
Figure 3.
Influence of CuE on cell cycle progression/distribution in SAS cells: (a) Cell cycle analysis of SAS cells after being cultured with CuE for 24 h; and (b) CuE induced an increase in subG1 (%). Cells were stained with propidium iodide to analyze DNA content and quantified by flow cytometry. Symbol (*) in each group of bars indicates that the difference resulting from treatment with CuE 0 μM is statistically significant at p < 0.05.

