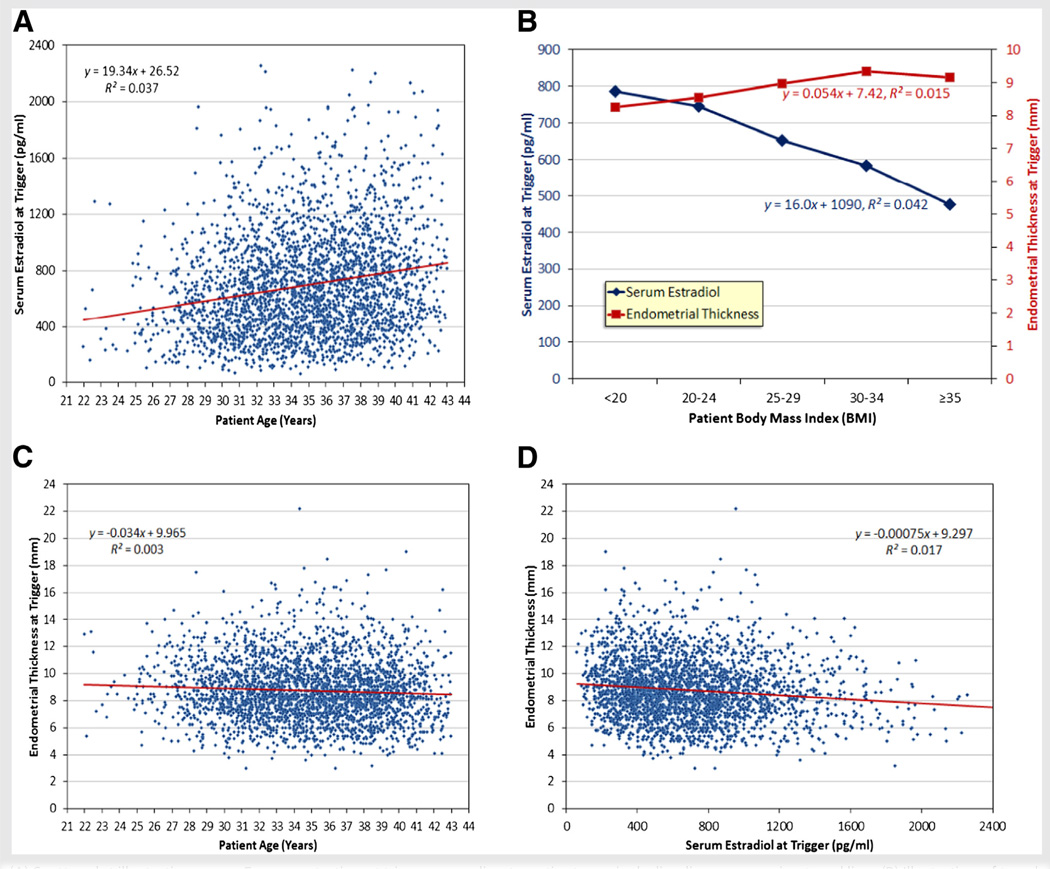
FIGURE 1.
(A) Scatter plot illustrating serum E2 concentration at trigger according to patient age, including linear regression trend line. (B) Illustration of trends in serum E2 concentration and endometrial thickness according to body mass index (BMI) categorization (<20 = underweight; 20–24 = normal weight; 25–29 = overweight; 30–34 = obese; >35 = very obese), with linear regression models indicated. (C) Scatter plot illustrating endometrial thickness at trigger according to patient age, including linear regression trend line. (D) Scatter plot illustrating endometrial thickness at trigger according to serum E2 concentration, including linear regression trend line.

