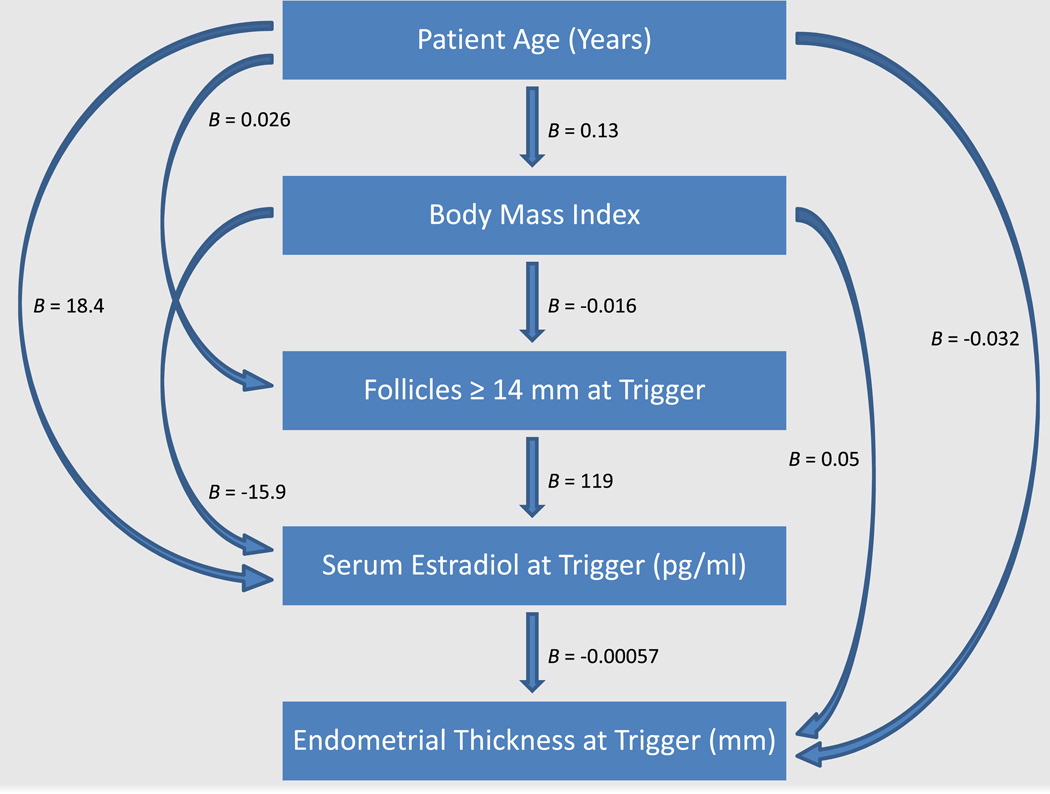
FIGURE 2.
Diagram of patterns of association among age, body mass index (BMI), mature follicles, serum E2, and endometrial thickness. Arrows indicate statistically significant associations between independent and dependent variables. Partial regression coefficients were derived from multiple regression models and indicate estimated unit changes in dependent variables per unit change in independent variables.

