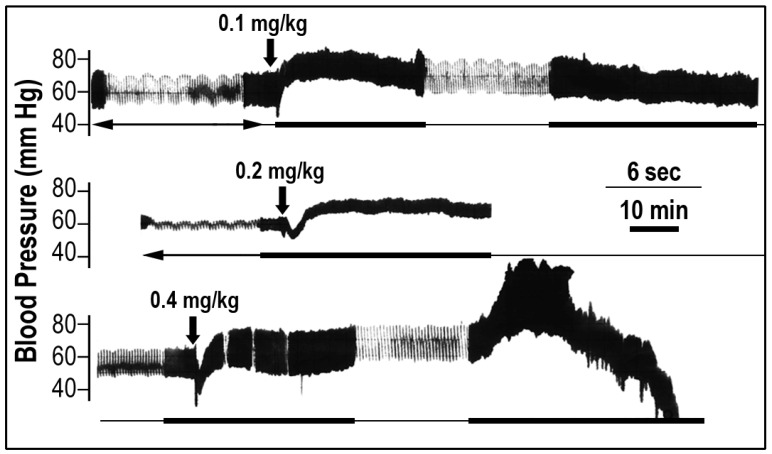
Figure 1.
The typical effect of Scorpio maurus palmatus venom on blood pressure. The original tracing of the experiments show the blood pressure response (mm Hg) after addition of different doses of venom indicated by the vertical arrow. Each trace represents a single rat receiving a single dose of venom (representing measurements of eight rats). The length of the horizontal lines represents the time course of the experiment: thin line (sec); thick line (min).

