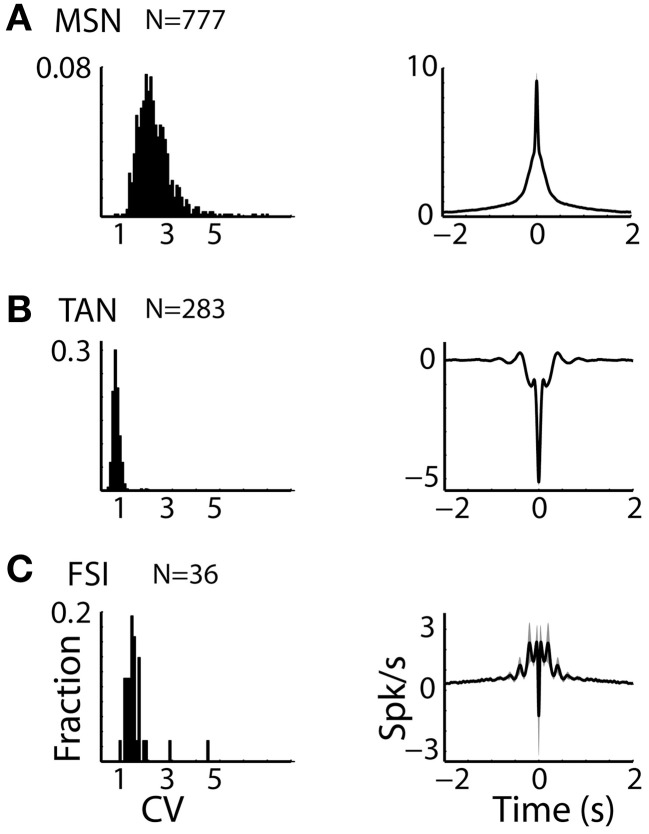
Figure 2.
Striatal MSNs, TANs, and FSIs display different firing patterns. (A) MSN discharge pattern. Left subplot: Distributions of the CV of the ISIs of striatal MSN neurons. Abscissa: CV. Ordinate: fraction of cells. Right subplot: Average ± SEM (solid line and envelope) auto cross correlation histogram of MSNs normalized by the average discharge rate and averaged over all cells. N is for number of neurons. (B) TAN discharge pattern. Same conventions as in (A). (C) FSI discharge pattern. Same conventions as in (A).

