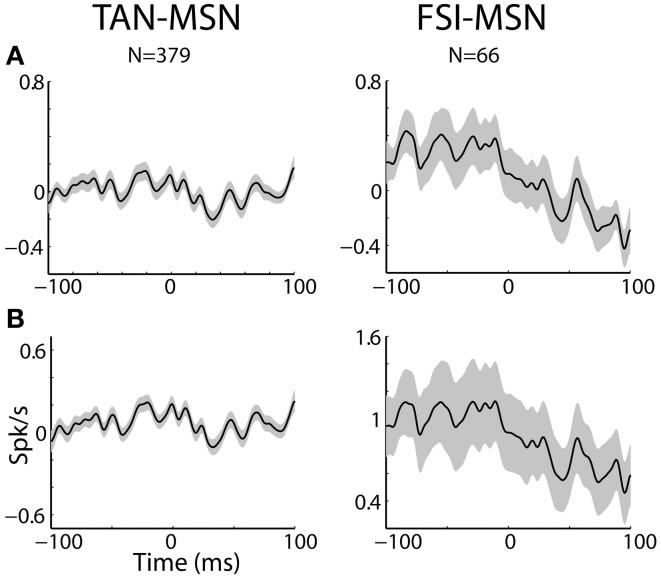
Figure 7.
MSN-interneuron pairs do not display narrow peaks or troughs in their cross correlation histograms. (A) Raw (with no normalization) cross correlation histograms (CCH) between pairs of striatal interneurons and MSNs averaged over all pairs. Black line and gray shaded envelope display average and SEM values, respectively. Cross correlation histograms were computed with 1ms bins for ±100 ms around the trigger spike and were smoothed using a Gaussian (SD of 2 ms). The MSN (trigger cell) discharge is at time zero. Ordinate: conditional firing rate (spikes/s) of the FSI and TAN (reference cell), given a spike of the MSN at time zero. Abscissa: Time lag (in ms) around the discharge of the trigger cell. Axis labels on lower left subplots apply for all subplots. (B) Normalized CCH (using the PSTH predictor) averaged over behavioral events for all interneurons to MSN pairs.

