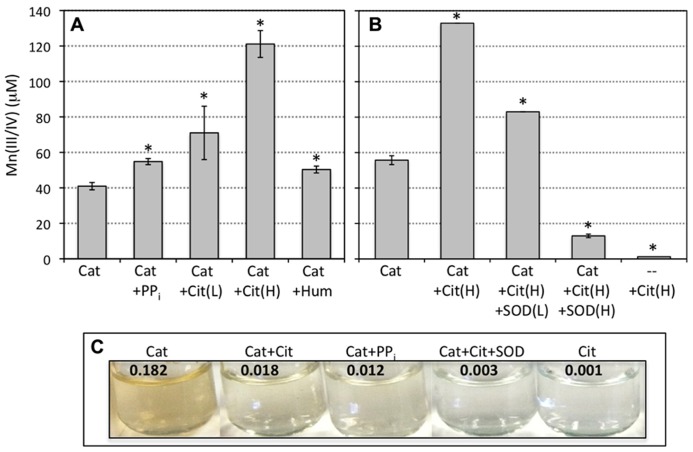
FIGURE 2.
(A) Abiotically produced superoxide (1 mM SOTS) reacted with Mn(II) (200 μM) in the absence and presence of catalase (Cat) and pyrophosphate (0.5 mM; PPi), citrate (0.5 and 5 mM, Cit(L) and Cit(H), respectively) or humic acids (10 mg/L). (B) Abiotically produced superoxide reacted with Mn(II) in the presence of 5 mM citrate and catalase and/or SOD (10 and 50 μM). Measurements are presented as the sample mean ± SD for replicate samples (n = 3). Asterisks indicate treatments that significantly (p < 0.05) differ based on the Student’s t-test (unpaired, two-tailed) from the control condition (catalase only). Brackets for SDs below 3% of the mean value are smaller than the width of the line. Intra-experiment variability was low (as evidenced by the low SDs) but there was slight inter-experiment variability due to minor deviations in reaction time, temperature in the lab, and SOTS concentration. Individual experiments are plotted separately for direct comparison to the corresponding control condition for each experiment. (C) Pictures depict the color of a subset of the reacted solutions following 24 h of reaction. The numbers at the top of pictures indicate the visible light absorbance at 700 nm, which is indicative of the Mn oxide colloid contribution. Background absorbance for SOTS reaction with 200 μM Mn(II) in the absence of catalase is 0.001.

