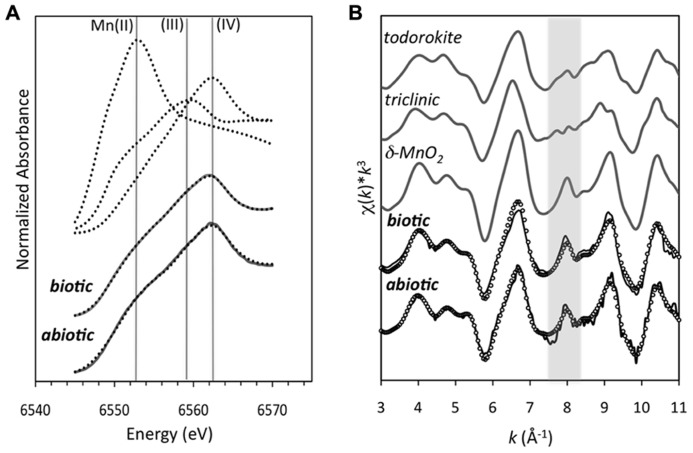
FIGURE 5.
(A) Mn K-edge XANES spectra of the Mn oxides produced from biotically produced Mn oxides after 4 h (after Learman et al., 2011b) and abiotically produced Mn oxides. The dotted lines represent the standards for Mn(IV) (δ-MnO2), Mn(III) (feitknechtite, β-MnOOH), and Mn(II) (MnCl2; as described in Bargar et al., 2005). The solid gray line is the linear combination fit (LCF) using the three Mn standards to represent the three oxidation states. (B) k3-weighted Mn EXAFS spectra (solid line) and linear-combination fit (dotted line) for the biotically and abiotically produced Mn oxides. The gray shaded area highlights the “indicator region” emphasizing the spectral differences that can be used to distinguish hexagonal (as δ-MnO2) from both triclinic birnessite (labeled triclinic) and todorokite (as described in Webb et al., 2005a).

