
Figure 2.
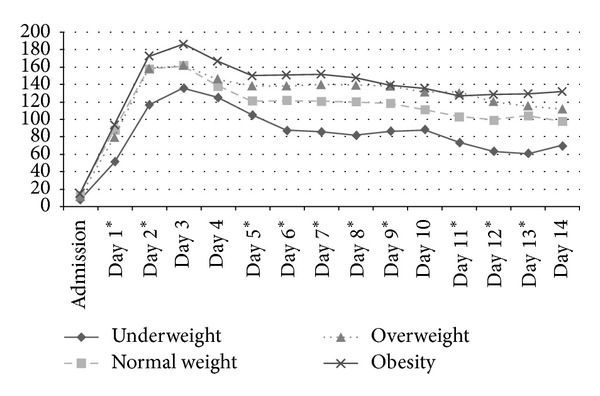
Mean CRP courses (mg/L) evaluated from admission to day 14 according to the BMI groups. Significant differences (P < 0.05) are marked with an asterisk referring to the day of distinction.
Official websites use .gov
A
.gov website belongs to an official
government organization in the United States.
Secure .gov websites use HTTPS
A lock (
) or https:// means you've safely
connected to the .gov website. Share sensitive
information only on official, secure websites.
Mean CRP courses (mg/L) evaluated from admission to day 14 according to the BMI groups. Significant differences (P < 0.05) are marked with an asterisk referring to the day of distinction.