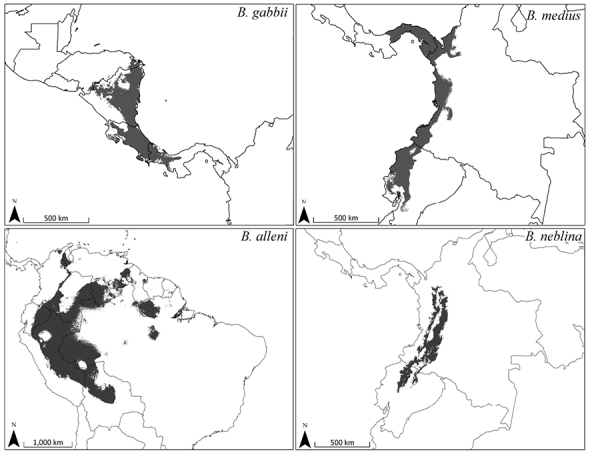
Figure 12.

Predicted distribution for Bassaricyon species based on bioclimatic models. To create these binary maps we used the average minimum training presence for 10 test models as our cutoff. In addition, we excluded areas of high probability that were outside of the known range of the species if they were separated by unsuitable habitat.
