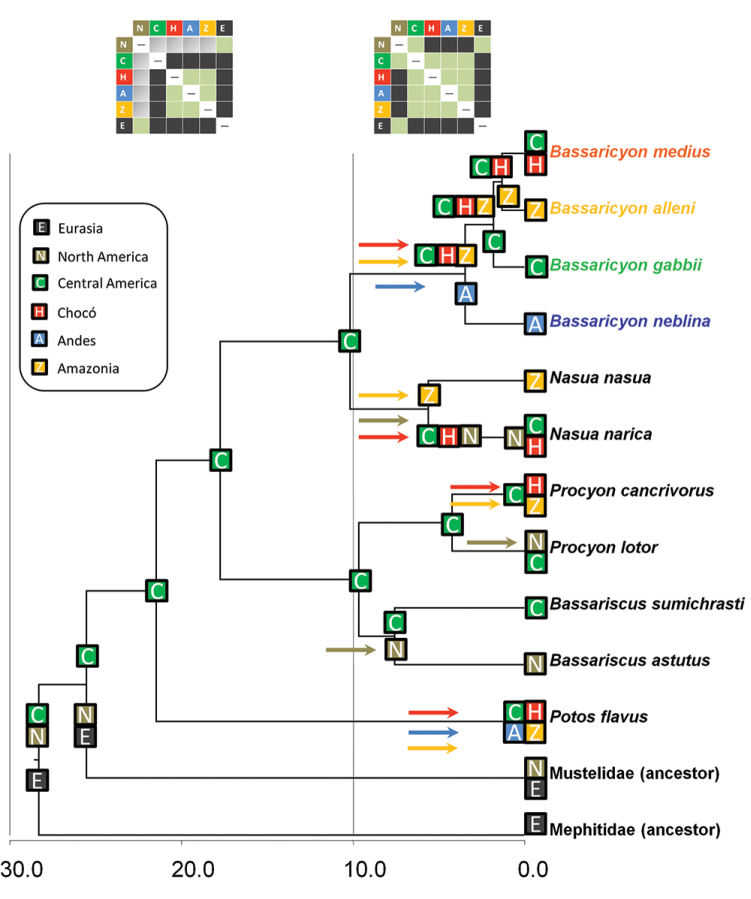
Figure 2.
Historical biogeography of procyonids. Reconstructed under the DEC model implemented in Lagrange. See legend for geographical areas used in the analysis. Colored squares at the tip of the branches reflect the distribution of taxa, and previously inferred distributions of the ancestors of mustelids and mephitids. Colored squares at the nodes represent the geographic ranges with the highest probabilites in the DEC model inherited by each descendant branch. Colored arrows reflect dispersal events between ancestral and derived areas, with colors matching with recipient areas. Upper boxes: different dispersal constraints at time intervals 0–10 mya and 10–30 mya, the former to simulate the effect of the land bridge formation between Central and South America, the latter restricted dispersal due to the absence of the land bridge; the cells in green indicate no restriction to dispersal, cells in gray indicate a reduction by half in dispersal capability, and cells in black do not allow dispersal. Timescale in millions of years before present (mya).

