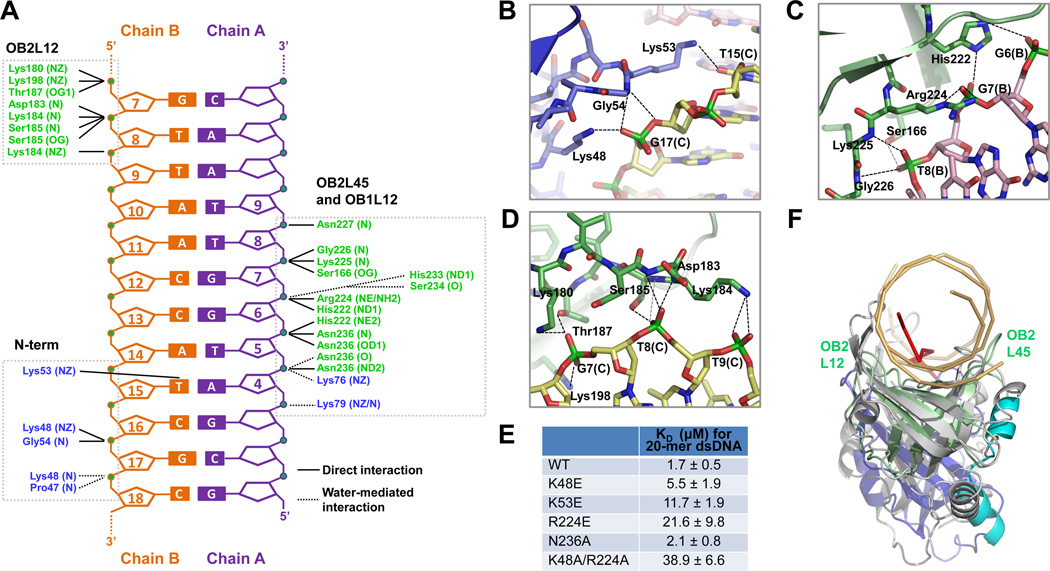
Figure 2. Detailed Interaction Between p202 HIN1 and dsDNA.
(A) Diagram summarizing HIN1/20-mer interactions. Non-interacting nucleotides are omitted. Three clusters of interaction (N-term, OB2L45 and OB1L12, and OB2L12) are boxed. Residues from OB1 and OB2 are shown in blue and green, respectively.
(B, C, D) Interaction details at N-terminus (B), OB2L45 and OB1L12 (C) and OB2L12 (D). Hydrogen bonds are represented by dashed lines.
(E) Summary of KD values of wild-type and mutant HIN1 with 20-mer dsDNA, determined by fluorescence polarization with fluorescein labeled 20-mer.
(F) Structural superposition of the HIN1/20-mer complex with the RPA/ssDNA complex. HIN1 and RPA (PDB ID: 1JMC) are superimposed using secondary structure (SSM) methods (Krissinel and Henrick, 2004). HIN1 is colored as in Figure 1A and dsDNA is in light orange. RPA is colored in gray and ssDNA in red. Dotted magenta arrows indicate the different conformations of L12 and L45 loops in HIN1 OB2 and RPA.
See also Figure S2.

