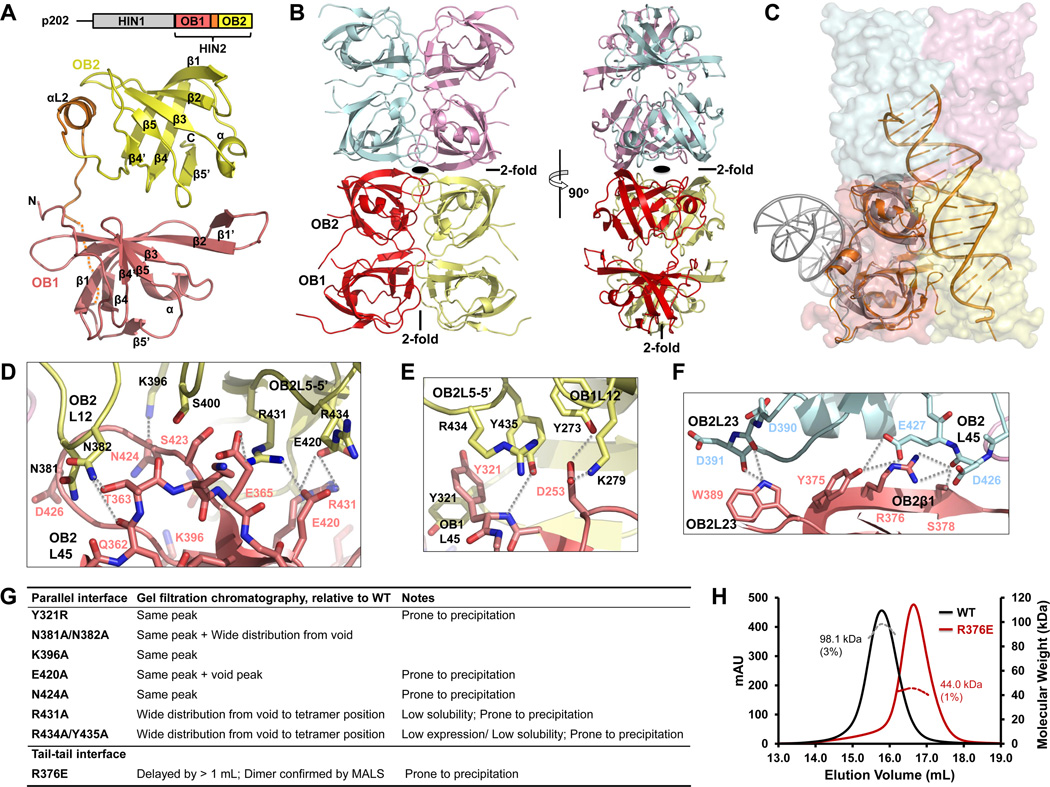
Figure 3. Tetramer Structure of p202 HIN2.
(A) Above, domain diagram of p202. Below, HIN2 monomer structure with secondary structures labeled. Residues without defined density are represented by the dotted line.
(B) HIN2 tetramer (dimer of dimers) structure in two orthogonal views with each monomer shown in light pink (A), yellow (B), pale cyan (C) and violet (D) , respectively. Locations of 2-old axes are either labeled or shown with a symbol.
(C) Monomer A (in light pink) in HIN2 tetramer is superimposed with the p202 HIN1/DNA structure (orange) and the AIM2 HIN/DNA structure (gray). While p202 HIN1 uses the similar interface for DNA interaction as in HIN2 for dimerization, AIM2 HIN uses the opposite surface for DNA interaction.
(D) Detailed interactions at the OB2-OB2 interface between parallel HIN dimers. Molecules A and B are colored in light pink or yellow as in (B). Residues mediating OB2-OB2 interaction are shown as sticks and labeled in light pink or black, respectively and secondary structures are labeled similarly. Hydrogen bonds are represented by dotted lines.
(E) Detailed interactions at the OB1-OB1 and OB2-OB1 interface between parallel HIN2 dimers. Residues and secondary structure motifs are colored and labeled as in (D). Hydrogen bonds are represented by dotted lines.
(F) Detailed interactions at the tail-to-tail interface of HIN2. Molecules A and C are colored in light pink or pale cyan as in (B).
(G) A summary of solution behaviors of HIN2 dimeric interface mutants.
(H) Molecular masses (MW) of wild-type HIN2 (black) and R376E mutant (dark red) were measured by multi-angle light scattering (MALS) coupled with size-exclusion chromatography.
See also Figure S3.

