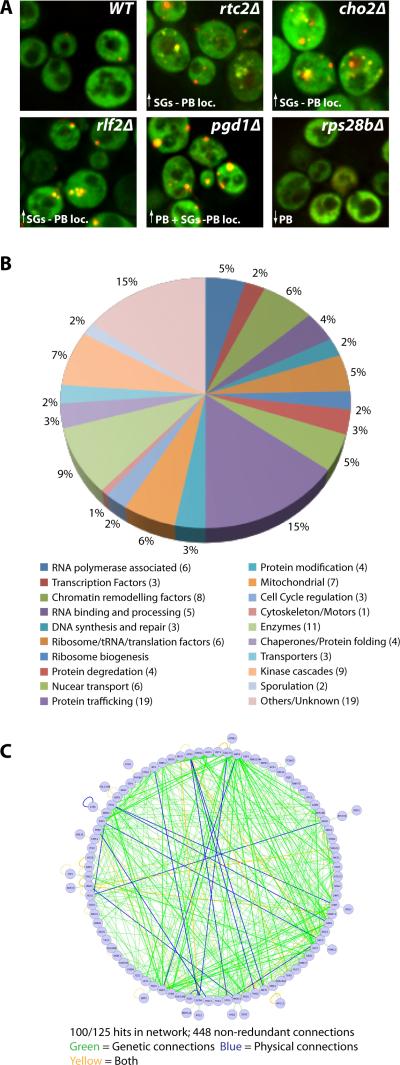
Figure 1. Overview of screen for genes affecting stress granule and P-body assembly.
A.) Typical screen phenotypes (log. growth). Pab1-GFP and Edc3-mCh serve as stress granule and P-body markers respectively. Examples of P-body localized stress granules (rtc2Δ, cho2Δ, rlf2Δ), increased P-bodies (pgd1Δ) and decreased P-bodies (rp28bΔ) are shown. B.) 125 screen hits categorized by GO-terms. C.) Network analysis of known physical and genetic connections of screen hits. See also Figure S3 and Table S1.

