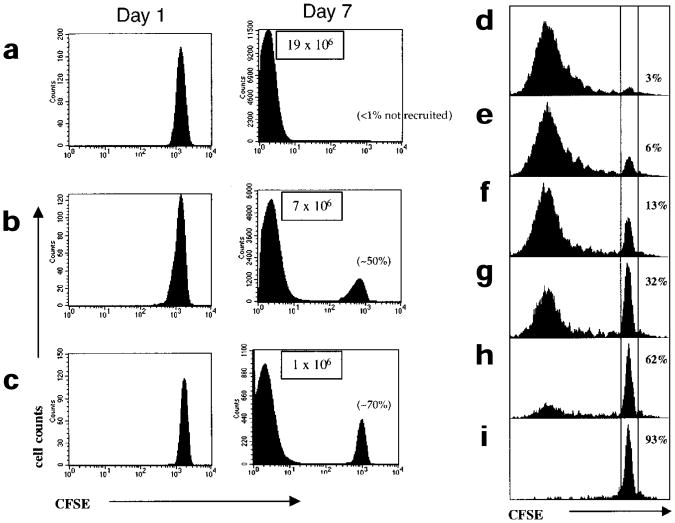
Figure 1. Varying the antigen dose affects the magnitude of the CD8+ T cell response and the recruitment of naïve CD8+ T cells, but all recruited cells divide extensively.
(a–c) CFSE-labeled naïve P14 CD8+ T cells (∼1–2×10⁶) were adoptively transferred into B6 mice and these chimeric mice were then infected with (a) high (3×10⁴ CFU) (b) intermediate (3×10³ CFU) or (c) low (100 CFU) doses of LM-GP33. On days 1 and 7 after infection the CFSE fluorescence of splenic P14 CD8+ T cells was analyzed by flow cytometry by staining with anti-CD8α and Db-GP(33–41) tetramer. Histograms show the CFSE intensity of CD8+Db-GP(33–41)+ T cells. Note that on day 7 after intermediate- and low-dose infections, the P14 CD8+ T cells are found in only two CFSE peaks: cells that had not divided and cells that had divided more than seven times and were CFSEneg. The percentage of P14 CD8+ T cells not recruited into the immune response are shown in parentheses. The total number of activated CFSEneg P14 CD8+ T cells in a representative experiment are in boxes. (d–i) CFSE-labeled P14 CD8+T cells (50,000) were cultured for 4 days in vitro with (d) 10,000 (e) 5000 (f) 1000 (g) 200 (h) 100 or (i) 0 GP(33–41)-pulsed splenocytes. The cells were stained with anti-CD8α and Db-GP(33–41) tetramers and CFSE fluorescence analyzed was by flow cytometry. The percentage of cells that were not activated and did not proliferate are indicated.

