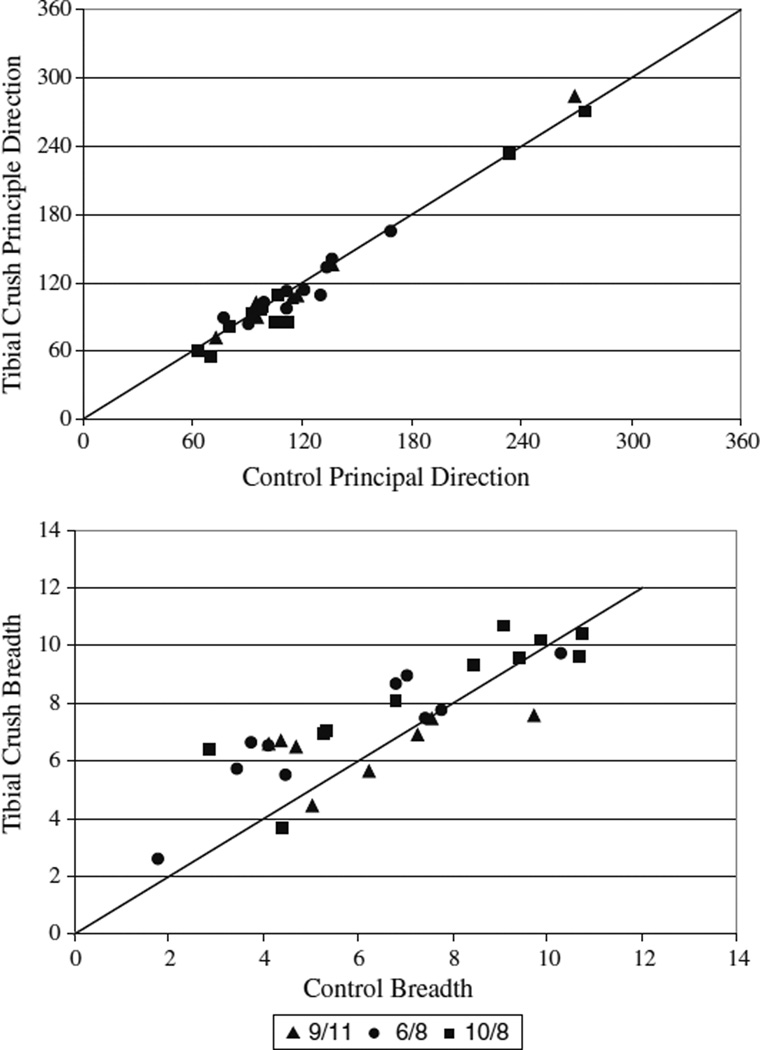
Fig. 2.
Principal direction and breadth comparison before and after cutaneous denervation of the foot pads. Principal direction and breadth were quantified before and after the cutaneous intervention. The mean and standard deviation of the principal direction and breadth before and after intervention are depicted along with a unity line (representing a ratio of 1 between conditions) for comparison of the conditions. Principal directions were largely conserved (top) with most ratios lying near or on top of the unity line. Breadths were shown to be more variable with most muscles showing an increase in breadth after tibial crush (bottom)

