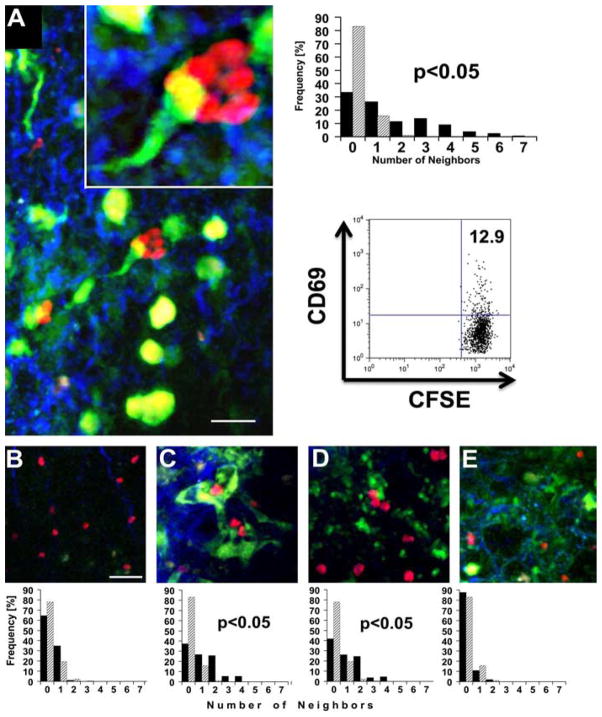
FIGURE 2.
T cell clustering in lung grafts and draining lymph nodes. A, B6 CD11c-EYFP+ → CBA graft showing adoptively transferred CBA T cells (red), CD11c-EYFP+ cells (green), and collagen fibers (blue). T cell neighboring analysis was performed on 14 representative z-stacks from three independent experiments (filled bars) and was significantly different from that performed on randomly placed T cells of equal density (hatched bars) (p < 0.05). Dot plot shows CD69 expression (11.5 ± 1%; n = 3) on adoptively transferred, CFSE-labeled, graft-infiltrating congenic T cells in C3H → B6 transplants at the same time point (p <0.05, compared with T cells isolated from native untransplanted lungs (3.5% ± 1.4; n = 3)). B, Adoptively transferred CBA T cells in draining lymph node 30 h after B6 CD11c-EYFP+ → CBA transplantation. C and D, CBA T cells injected on postoperative day 4 after B6 CD11c-EYFP+ → CBA transplantation and analyzed in lung grafts (C) and draining lymph nodes (D) 30 h after injection. E, B6 T cells, injected into B6 CD11c-EYFP+ → B6 transplants on day 0 and analyzed in lung grafts 30 h later. T cell neighboring distributions in C and D (p < 0.05), but not in B and E (p < 0.1), were significantly different from those of randomly placed T cells. Space bar, 20 μm.

