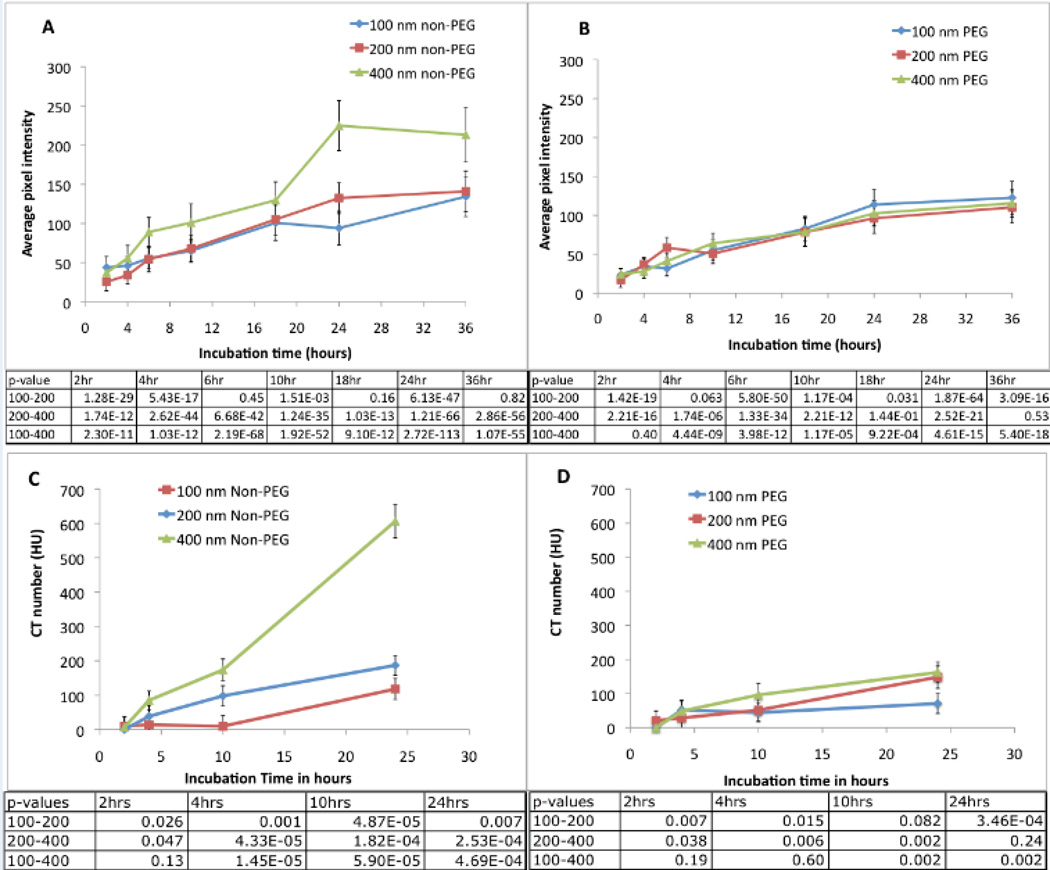
Figure 2.
Quantitative analysis of uptake of rhodamine-labeled non-PEGylated liposomes (A) and PEGylated liposomes (B) by RAW 264.7 macrophages. A total of 100 cells were used for the analysis. CT number of iodine-containing macrophages (C, D). Macrophages were incubated with non-PEGylated liposomal-iodine (C) and PEGylated liposomal-iodine (D). Error bars represent standard deviations.

