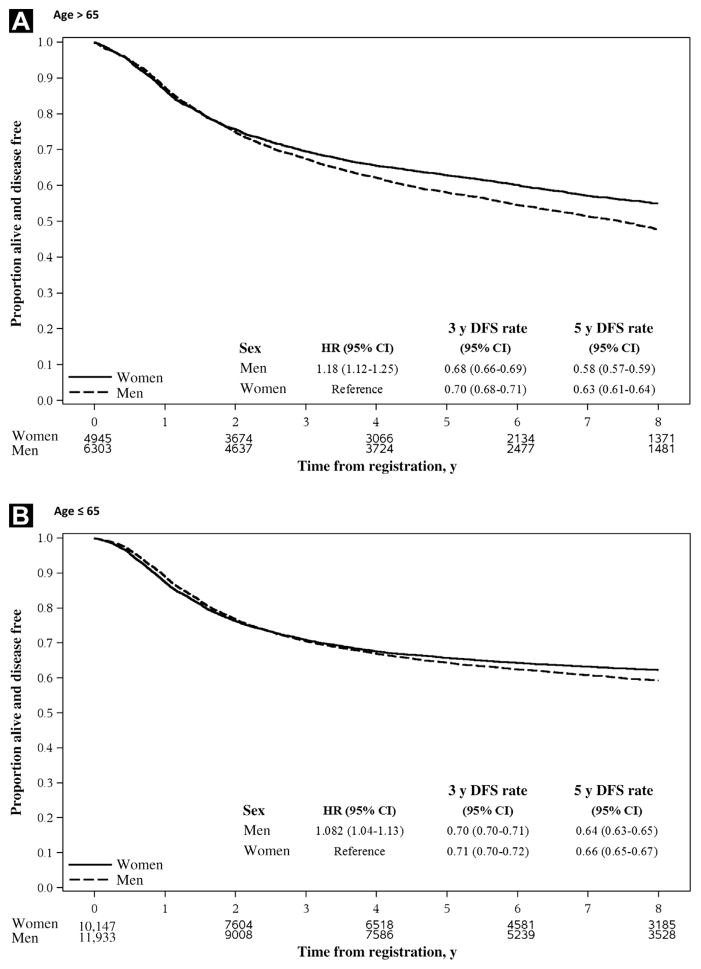
Figure 3. Kaplan-Meier Curves for DFS Stratified by Sex and Age Group. (A) Age > 65 y. (B) Age ≤ 65 y.
HRs (95% CI) were estimated by Cox model adjusted for stage and treatment and were stratified by study. The numbers under the graph are the number of patients at risk at randomization, 2, 4, and 8 y after randomization.
Abbreviations: DFS = disease-free survival; ECOG PS = Eastern Cooperative Oncology Group Performance Status Scale; HR = hazard ratio; LN = lymph node.

