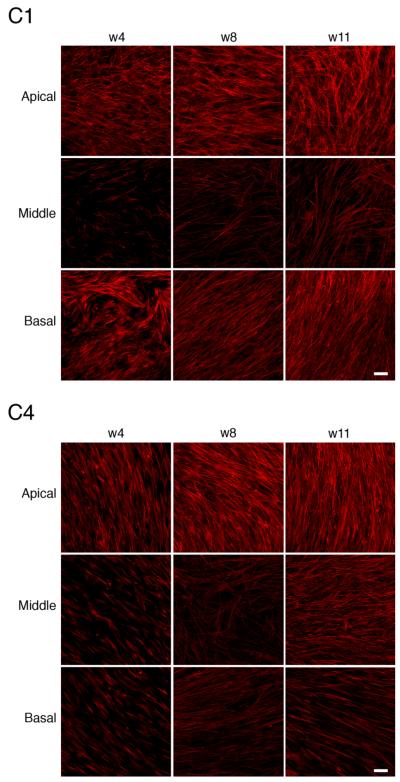
Fig. 3.
Confocal micrographs of 2 representative constructs (C1 and C4) at weeks 4, 8, and 11. The alignment of cells throughout the depth of the constructs is detected using rhodamine phalloidin, which labels F-actin filaments. Three different regions of each construct (apical, middle, and basal) are shown. The distance between optical sections is 0.5 μm. C1. week 4: The distance from apical to mid region, 7.5 μm; distance from mid to basal, 10.5 μm; week 8: distance from apical to mid, 11.5 μm; distance from mid to basal, 7 μm; week 11: distance from apical to mid, 9 μm; distance from mid to basal, 13 μm. C4. week 4: The distance from apical to mid, 5.5 μm; distance from mid to basal, 10.5 μm; week 8: distance from apical to mid, 25 μm; distance from mid to basal, 10.5 μm; week 11: distance from apical to mid, 13 μm; distance from mid to basal, 35 μm. Scale bar = 50 μm.

