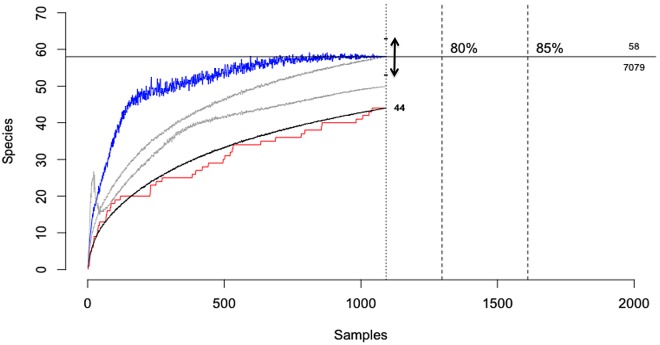
FIG 8 .
Viral discovery curve. A subset of 1,092 samples were tested for all nine viral families, and 44 viruses (out of a total of 55) are represented. The 11 viruses not considered were PgHV-2, -5, -6, and -9; PgAdV-1 and -10, PgAstV-4, -5, -6, and -8, and PgBoV-1. Black line, the rarefaction curve; red line, collector curve showing accumulation of novel viruses over samples tested; blue line, Chao2 estimator at every sample point, with arrow indicating 95% confidence intervals; gray lines, ICE and Jackknife estimators at every sample point; dashed vertical lines, required sampling effort to discover an arbitrary proportion of the total diversity (including 100%); horizontal line, total estimated diversity, 58 viruses, and effort required to discover 100% of the estimated diversity, 7,079 samples.

