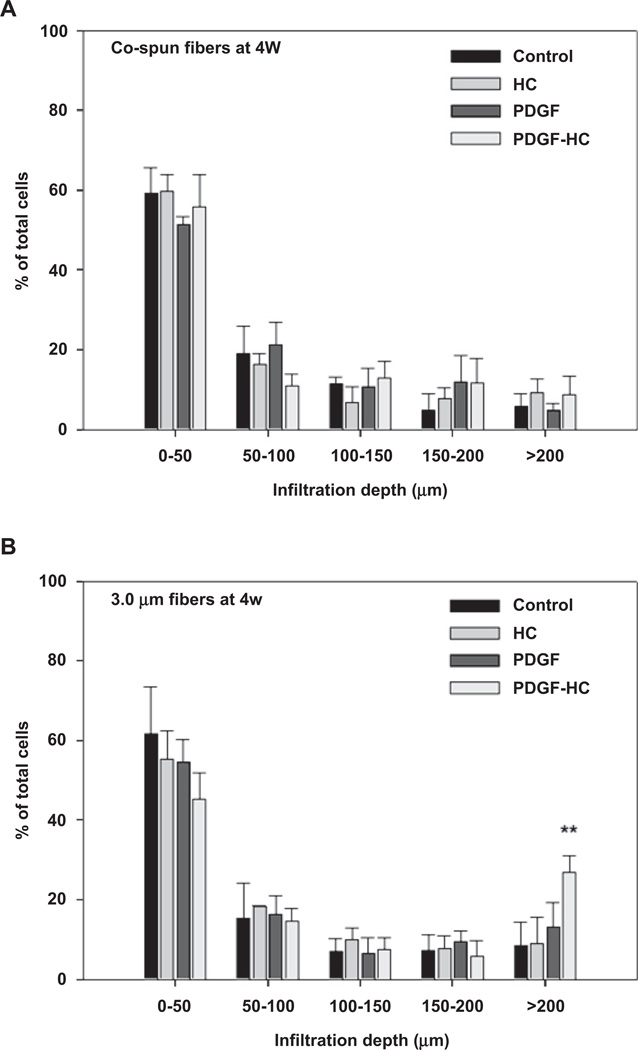
Fig. 8.
Quantitative analysis of SMC infiltration distance by proliferating cells on (A) co-electrospun and (B) 3.0 µm fiber scaffolds at 4 weeks of cell seeding: control, HC, PDGF, and PDGF-HC. For the analysis, a grid consisting of 50 µm thick lines was overlaid on the images shown in Fig. 7A and mean percentage of total cells at each depth range was then calculated (**P < 0.01 compared to others).

