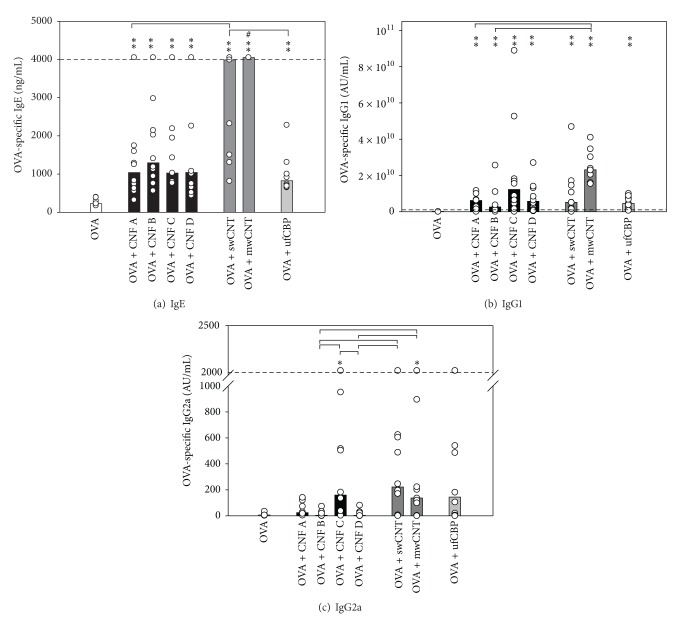
Figure 4.
Allergen-specific antibodies after intranasal coexposure to allergen and particles. Serum levels of OVA-specific IgE (a), IgG1 (b), and IgG2a (c) 26 days after intranasal exposure to 10 µg OVA alone (white bars) or together with 133 µg particles on days 0, 1 and 2 (total dose of 30 µg OVA and 400 µg particles). The four samples of CNF (black bars), swCNT and mwCNT (dark grey bars), and ufCBP (light grey bars) were used. On days 21, 22, and 23, all mice were boosted intranasally with 10 µg OVA (per day). Values (ng or arbitrary units (AU) per mL) for individual mice (circles) and median values (columns) for groups of ten mice are shown. If values were outside the dynamic range of the ELISA assays, the dotted lines indicate the lower or upper quantitative detection limits for the assays. Asterisk denotes significant differences compared to the OVA group, **P < 0.001,*P < 0.05. # Denotes significant differences compared to all other particle groups, P < 0.05. Brackets denote statistically significant differences between particle groups, P < 0.05.

