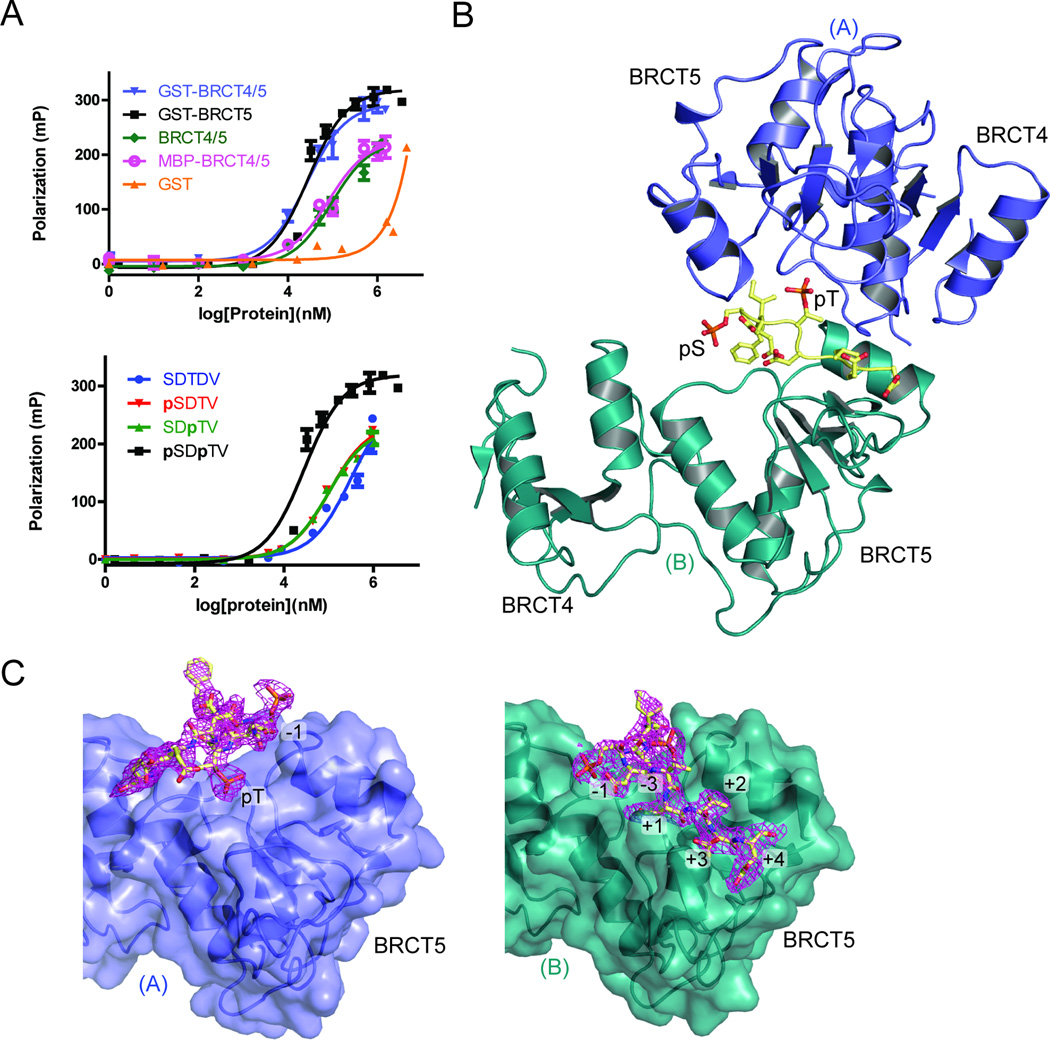
Figure 2.
MDC1 SDT di-phospho-peptide interactions with TopBP1 BRCT4/5. (A) FP binding results for the MDC1 FITC-labeled di-phospho-peptide and various TopBP1 proteins. Triplicate data points are represented in graphs as mean ± SEM. (Above) FITC-peptide binding results for GST, GST-fusion proteins of BRCT4/5 and BRCT5, as well as untagged BRCT4/5 and MBP-BRCT4/5. (Below) FP assay of non-phosphorylated, pSer, pThr or di-phosphorylated MDC1 FITC-labeled peptide with GST-TopBP1 BRCT5. (B) Crystal structure of MDC1 di-phospho-peptide in complex with TopBP1 BRCT4/5. The phosphorylated residues of the peptide (yellow) are labeled. BRCT4/5 protomer A (blue) and B (teal) are designated. (C) Di-phospho-peptide interactions with BRCT5 (represented in surface representation) of protomer A (left panel) and protomer B (right panel). The 2|Fo| - |Fc| electron density map for the di-phospho-peptide is shown in magenta and peptide-interacting residues are labeled. See also Figure S2.

