
Figure 6.
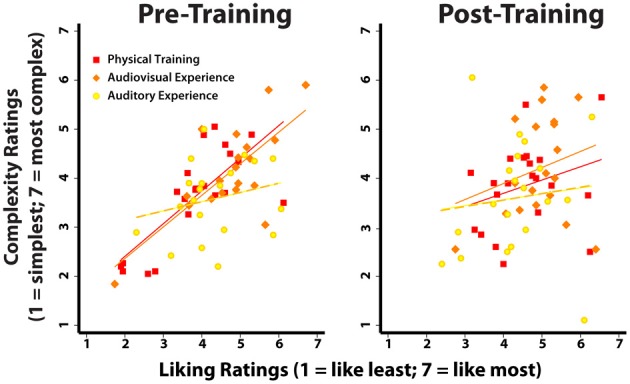
Correlations between complexity and liking ratings, before and after training. The left plot illustrates the positive correlation between liking and complexity before participants had any kind of experience with the dance stimuli [similar to the situation in Cross et al. (2011)]. The lines represent the regression lines of the correlation for each group, pre- and post-training (see the Results section for r- and p-values). The right plot illustrates that the positive correlation evident for the Physical Training and the Audiovisual Experience groups disappears after several days of training, such that those movements that are viewed as most complex are no longer associated with consistently high liking ratings.