
Figure 2.
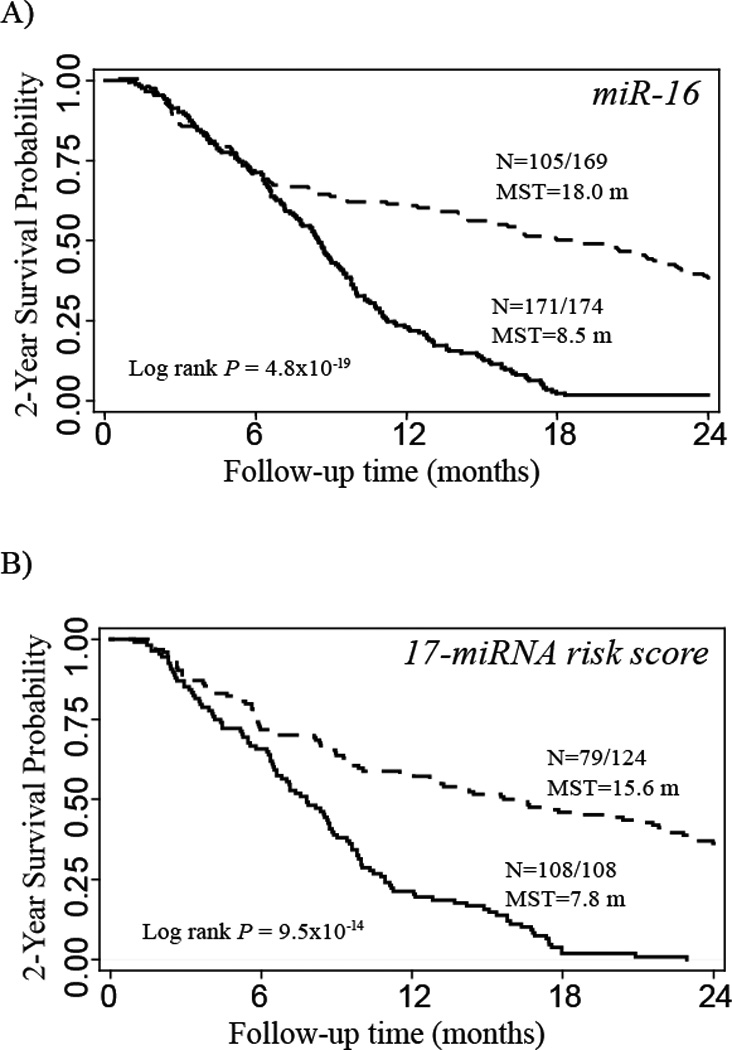
Kaplan-Meier 2-year survival curves for advanced NSCLC patients grouped by low (solid line) and high (dashed line) expression of serum miR-16 (A), and high (solid line) and low (dashed line) risk scores (B). N = number of patients with an event (death) at 2 years / total number of patients in the dataset. MST=median survival time.