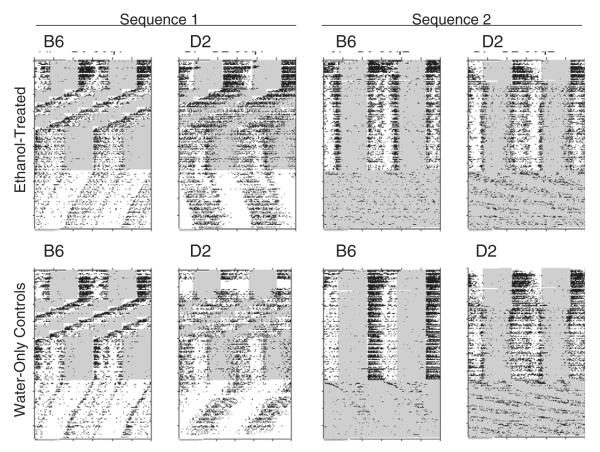
Fig. 1.
Double-plotted (48-hour span) raster-style circadian activity records for one representative animal from each strain (B6: C57BL/6J; D2: DBA/2J) and treatment group (Ethanol-treated vs. Water-only controls; Sequence 1 vs. Sequence 2). See text for details on experimental sequences. Shaded areas indicate times of light exposure.

