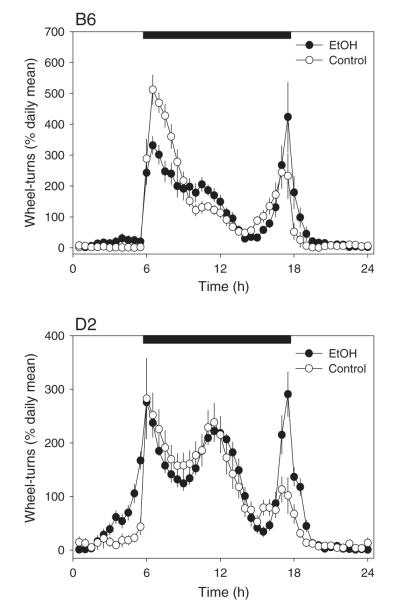
Fig. 4.
Averaged daily activity waveforms under initial light–dark conditions in ethanol-exposed (EtOH, black symbols) and water-only control animals (white symbols). The black horizontal bars indicate the hours of darkness under the light–dark cycle. Activity levels in each 30-minute bin were normalized to each individual animal’s daily mean prior to averaging across animals in order to eliminate the effects of individual and/or strain differences in activity levels.

