Figure 5.

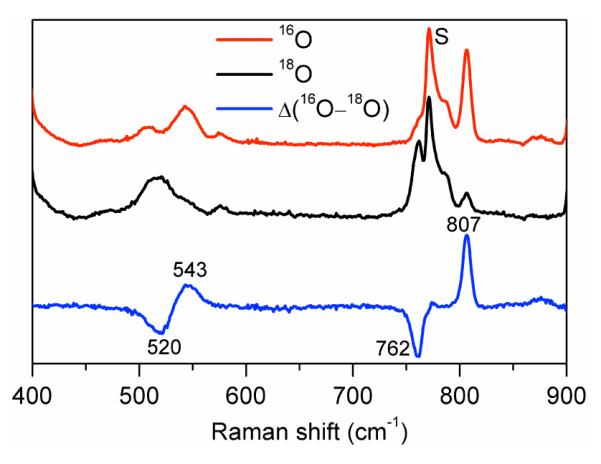
Resonance Raman spectra of 3 prepared in CH3CN with H216O2 (red, top) and H218O2 (black, middle) obtained with 514.5 nm excitation, 100 mW. The 16O – 18O difference spectrum is shown in blue (bottom). S = solvent.

Resonance Raman spectra of 3 prepared in CH3CN with H216O2 (red, top) and H218O2 (black, middle) obtained with 514.5 nm excitation, 100 mW. The 16O – 18O difference spectrum is shown in blue (bottom). S = solvent.