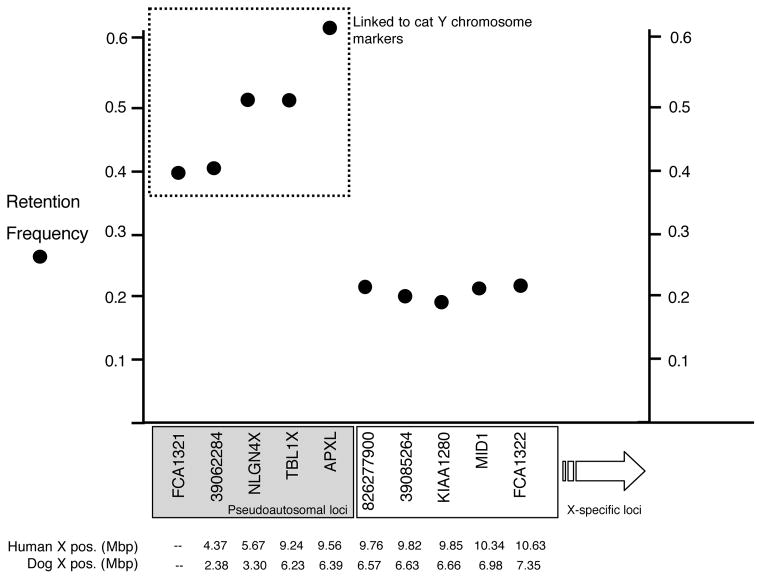
Figure 2.
Putative boundary of the feline pseudoautosomal region as defined by RH STS mapping. The retention frequency is plotted for the most terminal Xp chromosome markers in the cat RH map. The cat markers are listed based on the inferred HSB order with dog and human (Fig. 1). The physical coordinates for each marker (where known) in the dog and human genome sequences are shown below the x-axis. The pseudoautosomal markers are boxed in gray, and are also indicated by their linkage to Y chromosome STS markers (dashed box). X-specific markers have an average retention frequency around 0.20, very similar to the X chromosome-wide average.

