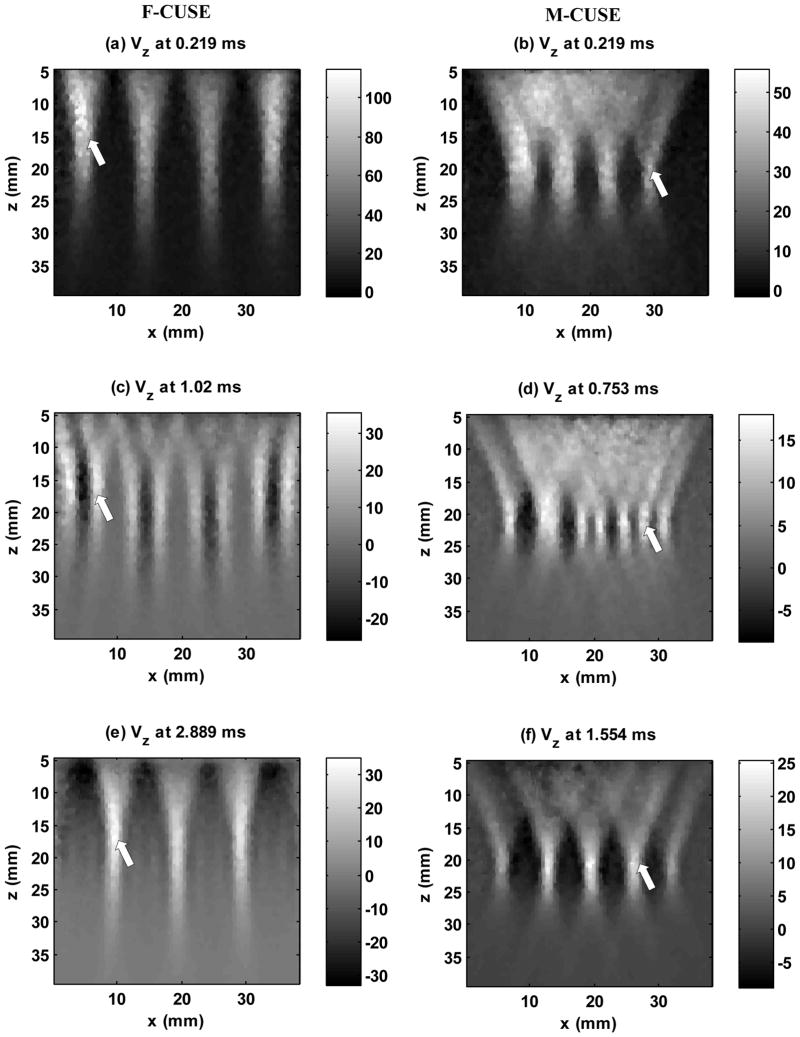
Fig. 2.
Plots of particle axial velocity at different time steps for F-CUSE and M-CUSE in a homogeneous elastic phantom with shear wave speed of about 1.5 m/s. Shear waves from different push beams interfere with each other and eventually fill the entire FOV. Left column: F-CUSE: (a), (c) and (e) show that four shear wave sources were generated by the four focused push beams. Each push beam generates two shear wave fronts that propagate away from the push beam. As indicated by the white arrow, the left-to-right shear wave from subgroup 1 appears in (c) and merges with the right-to-left shear wave from subgroup 2 in (e). Right column: M-CUSE. (b), (d), (f) show that four shear waves were generated by the four focused push beams. As indicated by the white arrow, the right-to-left shear wave from subgroup 4 appears in (d) and merges with the left-to-right wave from subgroup 3 in (f). The colorbar is in units of mm/s and the scale is different for each time step. “x” represents the lateral dimension. “z” represents the axial dimension.

