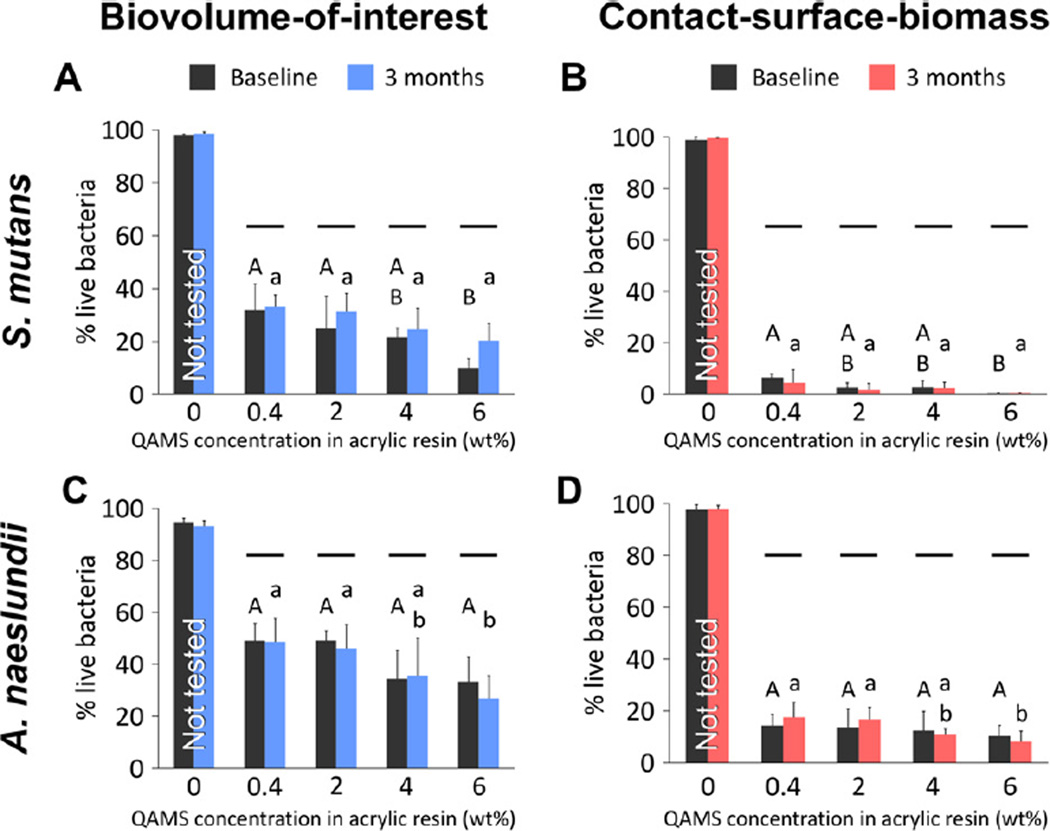
Fig. 1.
Percentage of live bacteria within the biovolume-of-interest (i.e. the volume of biofilm from the base to the 24th µm of a z-stack), and within the contact-surface biomass (i.e. within 2 µm from disk surface) of biofilms that were grown on acrylic resin disks from the control (0 wt.% QAMS) and four experimental groups (0.4–6 wt.% QAMS). (A, B) S. mutans biofilms. (C, D) A. naeslundii biofilms. For each parameter (upper case letters for baseline and lower case letters for 3 months), groups with the same letters are not statistically significant (p > 0.05). For comparisons between baseline and 3 months, groups connected with a horizontal bar are not statistically significant (p > 0.05).

