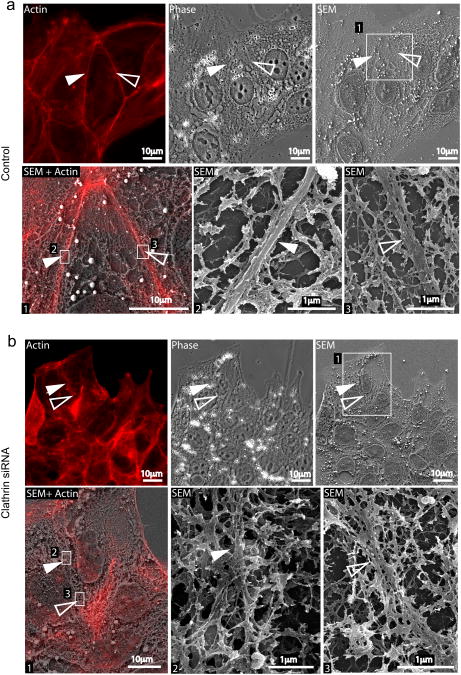
Figure 3.
CLSEM analysis of actin at cell-cell contacts in control and clathrin depleted cells. Jeg3 cells transfected with Cy3-tagged control (a) or anti-clathrin siRNAs (b) were permeabilized and labeled for actin (red). Cells were first imaged with an epifluorescence microscope (Actin and phase panels in a and b) and then processed for scanning electron microscopy (SEM). The ultrastructure of the cytoskeleton in control and clathrin knocked down cells was compared. In both a and b, panels 2 and 3 represent higher magnifications of the boxed areas in panel 1. Full and empty arrowheads point at actin structures at cell-cell contacts.

