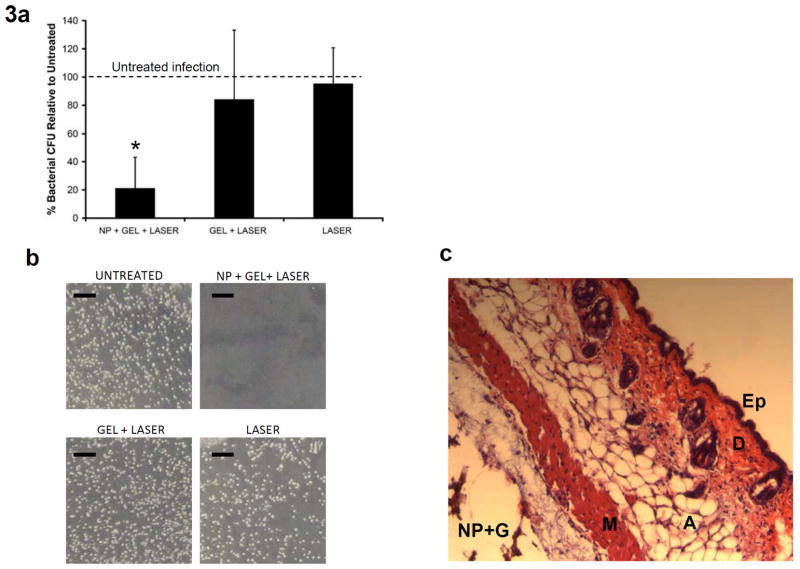
Figure 3.
In vivo treatment results and histology. a) Graph of percent bacterial CFU normalized to the untreated infection. The 3 groups represent infection sites receiving laser treatment (150 mW for 10 minutes). Star (*) indicates significant difference from untreated infection (p<0.01, Student t-test). NP concentration=40x, N=6 mice. b) Images of actual bacterial CFUs obtained from the 4 wound sites of mouse # 3 (see Table 1) showing infection eradication at the laser-treated NP+Gel wound site. c) Histology (H&E stain) of the NP+Gel site, indicating that the general tissue architecture is preserved after laser treatment. Ep: epidermis, D: dermis, A: adipose tissue, M: muscle, NP+G: Au-NP in silk hydrogel.

